What Is A Gantt Chart?
The Gantt chart makes it easier for project managers to manage resources, track challenges and find solutions, and update stakeholders on the status of their projects.
Here are the following topics we are going to cover:
- What is a Gantt Chart?
- Why do we need Gantt Chart?
- Types of Gantt Chart
- Advantages of Gantt Chart
- Application of Gantt Chart
- Conclusion
Watch this Project Management fundamentals video presented by Intellipaat
{
“@context”: “https://schema.org”,
“@type”: “VideoObject”,
“name”: “What Is Project Management”,
“description”: “What Is A Gantt Chart?”,
“thumbnailUrl”: “https://img.youtube.com/vi/Ug62niXleBE/hqdefault.jpg”,
“uploadDate”: “2023-02-27T08:00:00+08:00”,
“publisher”: {
“@type”: “Organization”,
“name”: “Intellipaat Software Solutions Pvt Ltd”,
“logo”: {
“@type”: “ImageObject”,
“url”: “https://intellipaat.com/blog/wp-content/themes/intellipaat-blog-new/images/logo.png”,
“width”: 124,
“height”: 43
}
},
“contentUrl”: “https://www.youtube.com/watch?v=Ug62niXleBE”,
“embedUrl”: “https://www.youtube.com/embed/Ug62niXleBE”
}
What is a Gantt Chart?
A Gantt chart is a tool used in project management to show the timetable for a project. Project managers can plan, schedule, and manage their projects more effectively using this type of graphic depiction.
The diagram is made up of horizontal bars that stand in for tasks in a project and include their start and finish dates. They bear Henry Gantt’s name, who created the chart in the early 1900s and is credited with its invention.
Gantt charts are essential for organizing and tracking a project’s progress. They could be employed to show that tasks are interdependent and to illustrate what resources are needed for each task.
They could be employed to manage several projects at once and to identify associated consequences and disputes.
Gantt charts can be used to identify and resolve project issues, manage resources, and ensure that tasks are completed on time. They are particularly useful for projects with multiple tasks and dependencies between them.
By displaying the dependencies between tasks in a clear and visual manner, various Gantt chart example helps project managers to understand the interconnections between tasks and to manage them effectively.
Want to become an expert in Project Management, check out this Project Management Certification Courses offered by Intellipaat.
Why do we need Gantt Chart?
An example of a bar chart used to plan, manage, and keep track of projects is the Gantt chart. It is a visual depiction of the many activities and tasks involved in a project, together with the associated deadlines.
Each work or activity is represented by a bar that is put on the timeline according to its start and finish dates, and the timeline is often separated into several stages.
This makes it simple to observe how activities interact with one another, how long it will take to do each activity, and how far along the project is in relation to its schedule.
There is always a question in people’s minds: what is a Gantt Chart used for? Actually, Project managers use Gantt charts to monitor the development of a project. They offer a comprehensive picture of the project and make it possible for project managers to see any issues or delays in the schedule.
Gantt charts may also be used to monitor the advancement of specific tasks or activities as well as to assess the general advancement of a project. They can also be utilized to spot any possible dangers or problems that can emerge throughout the project.
Types of Gantt Chart
Each type of Gantt chart has its own specific uses and benefits, and the right type of chart will depend on the needs of the project and the preferences of the project manager.
Regardless of the type of chart used, the Gantt chart remains a valuable tool for project management, providing project managers and teams with the information they need to effectively manage projects and ensure their success. Let’s discuss each of its types one by one:
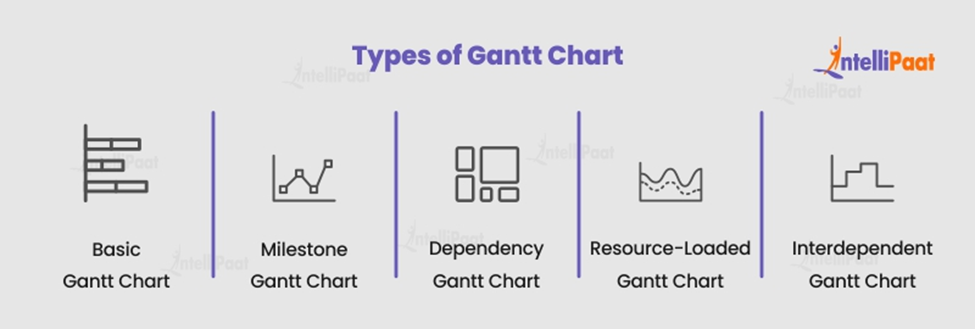
- Basic Gantt Chart: The basic Gantt chart is the simplest form of a chart.
It displays the tasks involved in a project and the timeline for their completion but does not include any additional information.
This type of chart is ideal for small projects with a limited number of tasks and a quite simple timeline.
- Milestone Gantt Chart: A milestone Gantt chart is a type of chart that focuses on the major milestones of a project.
It displays the key events or milestones in a project and the timeline for their completion, but does not include information about the tasks involved in achieving these milestones.
- Dependency Gantt Chart: A dependency Gantt chart is a type of chart that displays the relationships between tasks in a project.
It highlights the interdependencies between tasks, making it easier for project managers to understand how changes to one task can impact other tasks in the project.
- Resource-Loaded Gantt Chart: A resource-loaded Gantt chart is a type of chart that displays the distribution of resources across tasks in a project.
It provides project managers with information about the resources required for each task and the distribution of those resources across the project timeline.
- Interdependent Gantt Chart: An interdependent Gantt chart is a type of chart that displays the relationships between tasks and resources in a project.
It provides project managers with a complete view of the project, including the tasks, resources, and dependencies involved in the project.
Career Transition


Advantages of Gantt Chart
Gantt charts are a common project management tool because of all the benefits they provide. The following are some of the main advantages of employing Gantt charts:
- Visual Representation: Gantt charts provide a clear picture of how the different tasks in a project are related to each other and what the timeline looks like. This makes it easier to identify any potential conflicts within a project and make adjustments to ensure that everything is completed on time.
- Improved Communication: Gantt charts provide a common language for project teams to understand the project’s progress. By having a visual representation of the project, team members can easily communicate progress, deadlines, and changes.
- Easier Planning: Gantt charts make it easy to plan out tasks and timelines. They provide a clear timeline of the project and make it easier to prioritize tasks.
- Improved Resource Allocation: Gantt charts can help project managers identify where resources are needed and when. This makes it easier to allocate resources to ensure the project is completed on time and within budget.
- Improved Tracking: Gantt charts allow project managers to easily track and monitor the progress of tasks. This helps identify any potential risks and take action to reduce them.
Application of Gantt Chart
One of the most well-liked and often employed project management tools is the Gantt chart. They are visual representations of a project’s chronology that display the beginning and end dates of each task, the relationships between them, and the project’s overall progress. Here are a few of the main uses for Gantt charts:
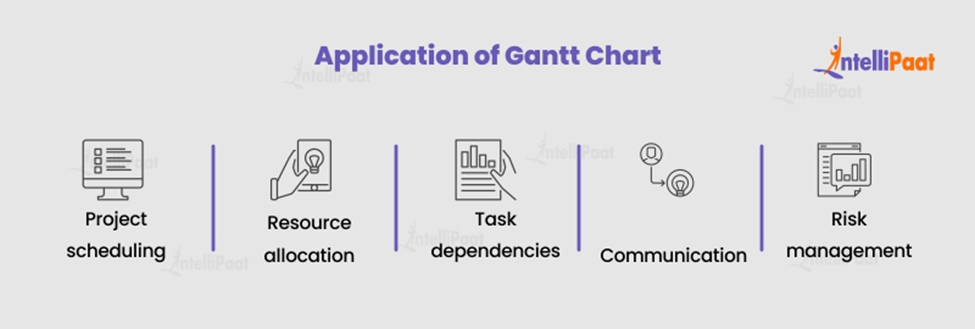
- Project scheduling: Gantt charts are used to schedule tasks, allocate resources, and track progress. They help project managers to visualize the timeline of the project, identify potential delays, and plan accordingly.
- Resource allocation: This type of chart provides a visual representation of resource utilization, making it easy to identify resource conflicts and allocate resources accordingly.
- Task dependencies: Gantt charts help project managers to understand the relationships between tasks, ensuring that critical tasks are completed on time and that the project remains on track.
- Communication: It provides a clear visual representation of the project timeline, making it easier to communicate project plans, progress, and expectations with team members, stakeholders, and clients.
- Risk management: Gantt Chart prepares a visual representation of the project timeline, making it easier to identify potential risks and plan mitigation strategies.
Preparing for jobs? Take a look at our list of the most asked Project Management Interview Questions!
Conclusion
Gantt charts are a powerful tool for project management and are widely used across a range of industries and applications. Gantt chart is a crucial tool for project managers since it gives a fast overview of the progress and milestones of a project. Hence, this type of chart is the most well-known among all charts.
Still, if you have any queries, then drop your message in Project Management Community.
The post What Is A Gantt Chart? appeared first on Intellipaat Blog.
Blog: Intellipaat - Blog
Leave a Comment
You must be logged in to post a comment.