Understanding the Sales Landscape with an Extremely Randomized Forest
Blog: Capgemini CTO Blog
The weather affects our health, our moods, the activities we participate in, and from a marketer’s perspective it drives our purchase decisions and the amount of money we spend. Weather affects product demand as well as supply, in all industries, whether it be: travel, clothing, food, energy, or home and garden. Being a nation of weather aficionados, we all know these truths, but how much better or how much worse should the weather be in order to actually impact us?
Consumer studies in the USA have shown that a change of as little as 1 degree Fahrenheit in outside temperature, whether increase or decrease has a substantial impact in the weekly sales over a wide range of products (see Figure 1).
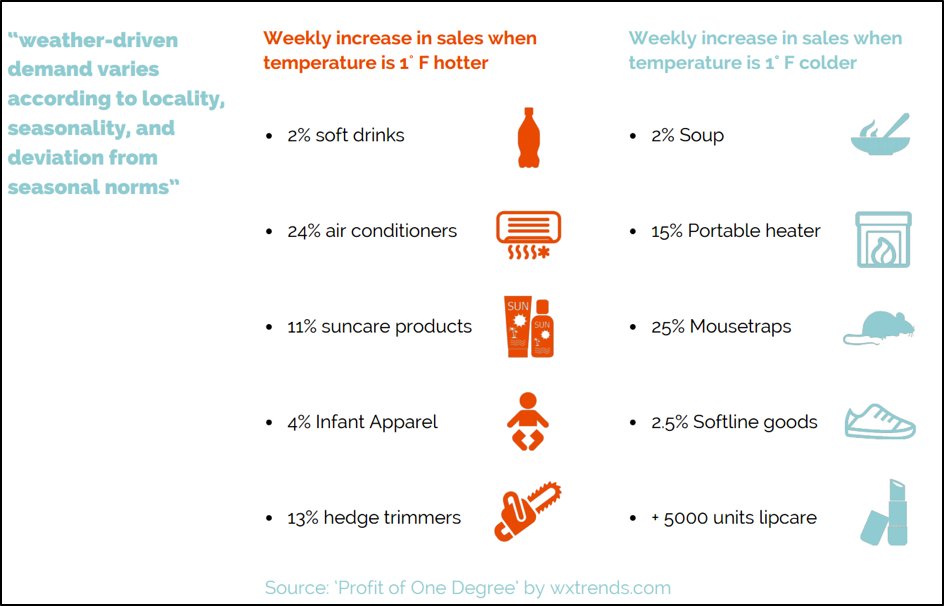
Figure 1: Weekly increase in sales in the USA when temperature changes by one degree Fahrenheit
Looking at Figure 1 it is evident people buy air conditioners in droves when the temperature gets warmer and likewise portable heaters are the norm when it gets cooler. Clearly the impact of weather on sales is very much dependent on the product or category of product, the location and the time of year. Previous work by Unadkat et al. at Capgemini, produced an eRetail Sales Index (Capgemini, 2016)[i] and showed that the fashion and garden sectors in the UK experienced significant growth in sales, as a result of exceptionally good weather.
“The country experienced record temperatures in May and this was reflected in the performance of the fashion and garden sectors, which both recorded significant growth.”
An alternative approach to understanding the weather – sales dynamics is to develop an index that models that impact of weather variation on sales.
Here I detail an approach to build such an index that will measure the weather’s impact on a company’s shipped volume of product, per month, given actual weather data, such as mean: sunshine hours, temperature and rainfall (mm) per month in the UK taken from the MetOffice. The weather index can easily be applied across different categories of product or sku, and will enable brand managers to justify variations in realised sales compared with expected ones. The case study presented here is applied to the total volume of ice cream shipped across the UK per month.
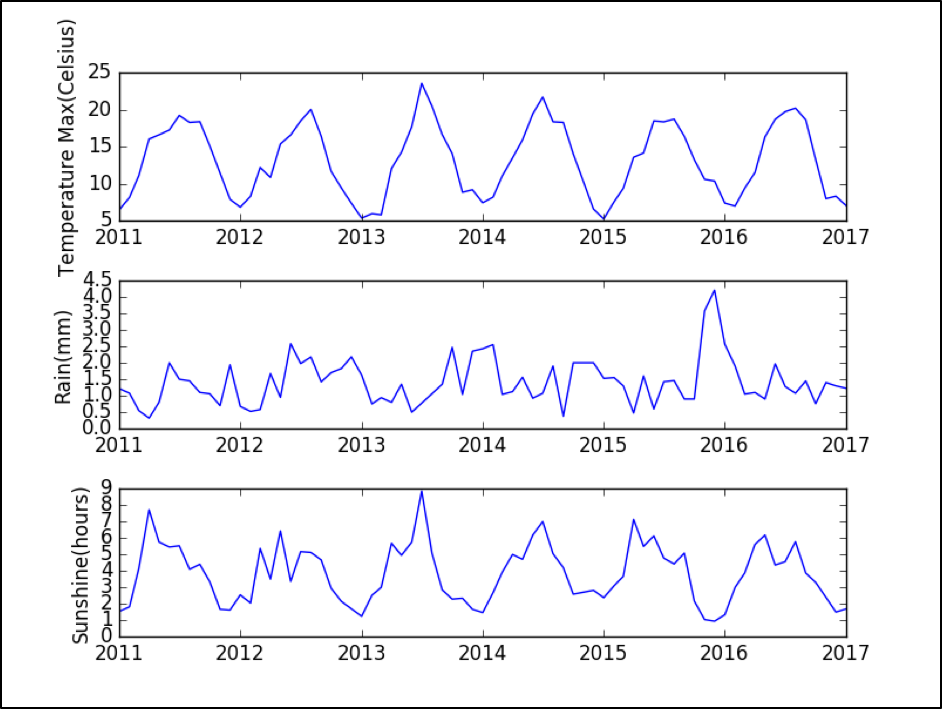
Figure 2: MetOffice data showing: average sunshine hours, average maximum temperature and average rainfall (mm) per month in the UK 2011-2017.
Figure 2, shows record breaking rainfall in December of 2015, putting 2015 amongst the top ten wettest years going all the way back to 1910 according to the MetOffice. Strong seasonal variations in sun and temperature can also be observed year on year.
Leveraging the weather data and information regarding the shipped volume per month, I created a baseline training dataset containing for each calendar month the typical shipped volume in typical weather conditions by averaging values across 6 years (2011-2016). Using this training dataset an extremely randomized trees regressor was trained. The machine learning model was applied to the actual observed weather conditions per month and used to generate the expected shipped volume in a given month given the observed weather, represented by PredVOLNORM. This workflow is illustrated in Figure 3.

Figure 3: Workflow to generate PredVOLNORM
Using the PredVOLNORM it was possible to predict the actual volume of shipped ice cream if the weather is the sole influencer (PredVOLACT), with an extremely randomised tree regressor, using leave one out cross-validation, as detailed in Figure 4.

Figure 4: Workflow to generate PredVOLACT, using extremely randomised trees regressor and leave one out cross-validation
The mathematics behind the models can be summarised as follow:
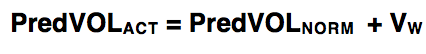
PredVOLACT is defined in equation 1 as:
 (1)
(1)
Where VW is the modelled impact on shipment volumes of the actual weather for a given month being better or worse than expected. Using this workflow I modelled the predicted actual shipped volume (PredVOLACT) and expected shipped volume (PredVOLNORM) per month for total ice cream sales from 2011-2017 in the UK (see Figure 5). The predicted values follow closely the shipped volume with a number of differences reflecting the weather impact.
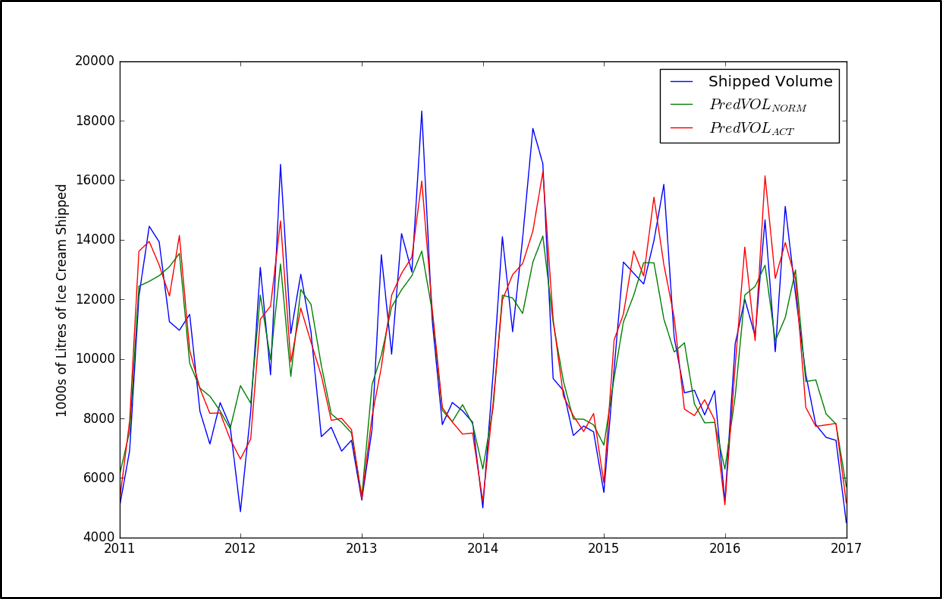
Figure 5: Actual shipped volume, predicted actual shipped volume and expected shipped volume per month in the UK 2011-2017.
Given the predicted actual shipped volume and expected shipped volume, the sales variability can be calculated as follows:
![]() (2)
(2)
Equation 3 details the percentage accuracy of the model used to predict the actual volume (shipped volume):
 (3)
(3)
Combining (1), (2), (3) the weather index can then be written as:
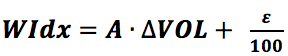 (4)
(4)
In an ideal model, where weather would be the sole contributor to sales volume,
![]() (5)
(5)
where A is a constant and ∆𝑉OL is the sales volume variation due to weather.
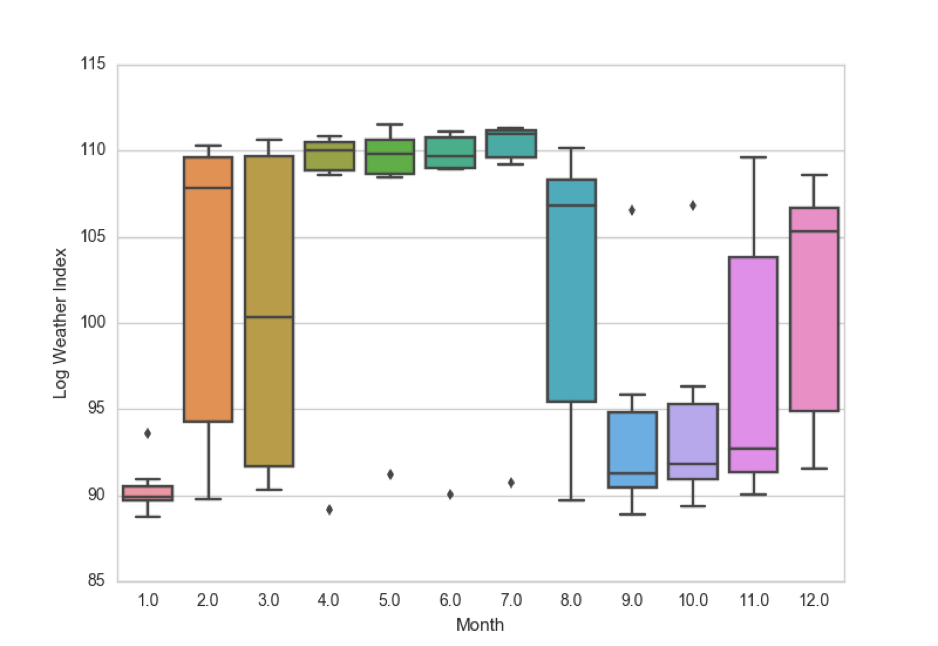
Figure 6: Weather impact index for total ice cream in the UK 2011-2017, broken down by month.
The average percentage error reported for PredVOLACT for total ice cream for the UK from 2011-2017 was 10.1%. Figure 6 shows the variation in weather index from 2011-2017 by month. It is interesting to note that January, September and October have consistently low weather indices, whilst April through to July have consistently strong positive weather indices. Such an explanation is that in the summer people eat more ice cream outside when the weather is better. In the autumn worse weather results in less ice cream sales. However, winter sees an anomaly, people tend to stay indoors more the worse the weather, and surprisingly eat more ice cream as is evident from the positive impact negative weather has on sales.
“As it is a truth universally acknowledged that nothing casts away a winter blues like a delicious pot of ice cream.”
While this model was developed for the food market, it can easily be adapted to respond to any other marketing demand giving an efficient and reliable measure of the weather impact on product sales.
[i] Unadkat et al (2016). IMRG Capgemini eRetail Sales Index: Hot weather drives strongest April to May growth in 10 years, url:https://www.uk.capgemini.com/news/uk-news/imrg-capgemini-eretail-sales-index-hot-weather-drives-strongest-april-to-may-growth-in [Accessed: 2nd August 2017]
Leave a Comment
You must be logged in to post a comment.