Top 10 DevOps Monitoring Tools
- What is DevOps Monitoring?
- Importance of DevOps Monitoring
- Different types of Monitoring Tools in DevOps
- Top 10 DevOps Monitoring Tools
- Conclusion
Discover more about DevOps and the top DevOps tools
What is DevOps Monitoring?
DevOps is the process of monitoring everything from strategy to development, from integration to testing, and from deployment to operations. It provides a comprehensive, real-time view of the status of production applications, services, and infrastructure. Real-time streaming, historical replay, and visualization are the crucial aspects of application and service monitoring.
Importance of DevOps Monitoring
With DevOps monitoring, teams can react quickly and automatically to any changes in client experience. In addition, it enables developers to shift left to earlier phases of development, reducing the number of broken production changes. Problems can be detected and dealt with manually or automatically as required with better software instrumentation.
Different Types of Monitoring Tools in DevOps
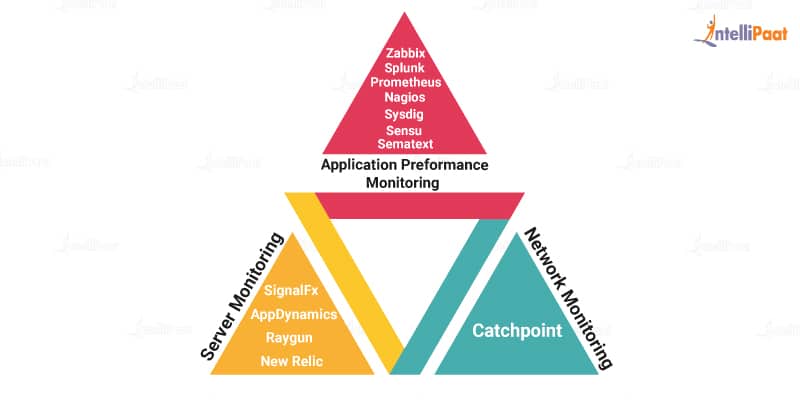
Most of the monitoring tools in DevOps have been categorized into the following types.
- Server monitoring: Also known as resource monitoring or infrastructure monitoring, server monitoring collects information about your server’s performance. It provides statistics on RAM consumption, CPU loads, and disk space left. It is helpful in aggregating data from virtual server systems for cloud-based scenarios.
- The following are a few server monitoring tools in DevOps:
- Prometheus
- Splunk
- Nagios
- Zabbix
- Sysdig
- Sematext
- Sensu
- Network monitoring: It examines the data flowing in and out of your computer network. Using this monitoring tool, you can keep track of incoming requests and responses across all components, from switches to firewalls and servers.
Catchpoint is a network monitoring tool in DevOps
- Application performance monitoring: It measures how well a service is performing overall. These tools query the server on their own and keep track of metrics such as response time and completion. It is essential to ensure that application performance issues are promptly detected and diagnosed so that services can function as intended.
The following are a few application performance monitoring (APM) tools in DevOps:
- SignalFx
- AppDynamics
- Raygun
- New Relic
Top 10 DevOps Monitoring Tools
Here is a list of the best DevOps monitoring tools. These tools will help you to gear up for your work and progress in your career.
Sensu
Sensu is one of the top DevOps monitoring tools; it is used for monitoring infrastructure and applications solutions. This platform allows you to measure and monitor the health of your infrastructure, applications, and business KPIs.
Sensu combines dynamic, static, and temporary infrastructure to solve modern challenges in modern infrastructure platforms. Sensu does not offer software-as-a-service (SaaS,) but you can monitor your system just the way you want.
Features:
- It sends alerts and notifications.
- It provides dynamic registration and de-registration of clients.
- It is not affected by the presence of mission-critical applications or multi-tiered networks.
- It is perfect for automating processes.
- Despite being open-source, it has excellent commercial support.
Learn more about the Advantages of DevOps in our blog post.
PagerDuty
PagerDuty is an operations performance platform designed to work closely with operations staff to assess the reliability and performance of apps and address errors as early as possible.
When timely alerts come in from the development environment to the production environment, the operations team can detect, triage, and resolve the alerts faster. PagerDuty offers an excellent, easy-to-use incident response and alerting system.
Features:
- The intuitive alerting API of PagerDuty makes it very popular among users.
- If an alert does not respond after a set amount of time, the system will auto-escalate by the originally established SLA.
- It is a powerful GUI tool for scheduling and escalation policy.
Datical Deployment Monitoring Console
Datical deployment monitoring console is the solution that you would use to automatically track the deployment status of each database across the enterprise. This software receives and records SQL script execution events across the entire deployment environment. It does that to minimize human errors. In addition, it simplifies database auditing and deployment monitoring.
Features:
- A significant advantage that datical deployment monitoring console (DDMC) offers is the simplified auditing of databases.
- It tracks deployments and errors automatically.
- It provides access to deployment information on-demand.
- In addition, it simplifies the release processes so that both users and administrators can automatically track, audit, and resolve all deployment-specific database issues.
Tasktop Integration Hub
Tasktop integration hub incorporates all tools within an organization into a single application to offer value to the organization. Tasktop integration hub is a single-point solution that handles all software delivery integration requirements without referring to another tool.
Tasktop integration hub is a powerful tool to deliver the right information to the right people at the right time, using the right tool with the right interface.
Features:
- Connectivity is available for 45 tools that are fully functional without a problem.
- It allows the addition of new tools to existing software integration quickly.
- You can route artifacts as well as specific field updates according to a filter that complies with customer requirements around frequency and direction.
- It provides a secure login via a web-based interface.
- By monitoring changes to artifacts, this software runs at the lowest possible footprint and reduces the load on other tools.
Career Transition


Librato
With Librato, you can track and understand, in real-time, the metrics that affect your business at every level of the stack. Librato offers all the features that are needed to monitor a solution including visualizations, analyses, and alerts on all the metrics discussed above. This tool is capable of aggregating and also transforming real-time data from virtually any source.
Features:
- It is a complete solution that monitors and analyzes data.
- It offers a variety of services that help in data monitoring and providing data visualizations.
- It offers services that provide notifications on completing activity processing on various metrics.
- It does not require any installation.
- It has an easy-to-use user interface.
- The alerts received from Librato are reliable, which helps you take necessary actions based on a possible situation in your production environment.
Prometheus
Prometheus is another metrics-based time-series database aimed at white box monitoring. Prometheus is a community-driven open-source system monitoring and alerting solution with a thriving ecosystem. Since its debut, numerous organizations and businesses have integrated this tool into their ecosystems, allowing the user and developer communities to interact.
Features:
- It is a tool developed in the Go programming language, making it an excellent contender for future advancements.
- It can gather time-series data for your organization and enable easy connection with PagerDuty.
- It has no dependencies and gives a good amount of Web API for custom development.
- The information gathered by this tool is useful in the field of business intelligence.
Kibana
Kibana is an open-source analytics and visualization tool that was created particularly to interact with Elasticsearch. The most common uses of Kibana are searching, viewing, and interacting with data stored internally in Elasticsearch indices.
In Kibana, advanced data analysis and visualization may be accomplished with ease by using charts, tables, and maps.
Features:
- It has a quick and uncomplicated setup procedure.
- You can view the data in the log to discover solutions to your difficulties in production.
- It provides an auto-highlighting function for the search fields to identify problems in your log files quickly.
- It allows you to visualize log files and display the necessary data and real-time statistics in graphics.
Courses you may like
Splunk
Splunk is a sophisticated platform for analyzing machine data, especially logs generated frequently but seldom used effectively. Splunk is used for searching, monitoring, and analyzing machine-generated data using a web-based interface. It compiles all pertinent data into a central index that allows users to find the required information quickly.
Features:
- It enables the examination of data from networks, servers, apps, and various other data sources.
- It is simple enough to deploy in a production environment.
- It provides attributes such as Splunk light to transfer data from many servers to the main Splunk engine for analysis.
- It indexes data in such a way that it produces powerful analytic insights.
- Its reports are accurate to the decimal point, allowing any organization to identify steps for improvement and take action, if necessary.
Preparing to become a successful DevOps Professional? Check out DevOps Interview Questions and Answers.
Nagios
Nagios is one of the DevOps tools for continuous monitoring. It is a widely-used open-source tool. In a DevOps culture, Nagios can assist to monitor systems, applications, services, and business processes. It notifies users when anything goes wrong with the infrastructure and later rectifies the problem.
Features:
- It is a great product that can do rapid tests and is easy to configure from both client and server sides.
- You can develop custom plug-ins that match your requirements and check the most critical production environment requirements.
- The documentation on the Nagios website is rather comprehensive, and you may use it for any specific reference.
- It has a feature that allows you to set up services to ping devices in an organization.
Dynatrace
Dynatrace is the smallest library that will run in the application process without consuming more than 10 MB of server memory. As a result, the application logs are monitored without causing any conflict on the server, resulting in lower overhead on the server.
Adding or removing Dynatrace agents from application servers does not even require the restart of application servers.
Features:
- You can see how long each stage of an application took as well as the transaction flow.
- It indicates clearly where problems or errors arise in production workflows.
- It identifies deviations from a standard baseline after the metrics have been benchmarked.
- It detects any unusual activity in the application or network and communicates this information to you.
- It gives non-technical users a clear picture of an application’s performance.

Conclusion
I hope, now, you’ve got a clear idea of the DevOps monitoring tools. If you are aspiring to become a DevOps engineer or progress in your career, visit the Intellipaat website and enroll yourself in the DevOps Certification Training course to learn more about DevOps.
Resolve your queries by asking them out in our DevOps community right away!
The post Top 10 DevOps Monitoring Tools appeared first on Intellipaat Blog.
Blog: Intellipaat - Blog
Leave a Comment
You must be logged in to post a comment.