

Tableau Projects for Practices: Sample Superstore
Tableau is one of the most popular tools that allows you to connect various data sources, analyze data, and visualize it to generate better insights. It’s a leading visualization tool used by the majority of businesses and tech firms to analyze their datasets. By putting the least effort into your datasets, you can achieve maximum results.
Tableau is widely used by Business Analysts to collect datasets from different sources and transform them into valuable information that can be used to make data-driven decisions. Plus, it features several tools through which you can share the processed data with other users throughout the organization and have live interactions with the reports.
In order to learn data analytics and Business Intelligence, you need to understand the key concepts and techniques used to transform the data in Tableau. And, the best way to understand those concepts is by working on different projects. So, let’s get started and go through the topics that we’ll be covering in this tutorial.
- Tableau Project for Practices
- Tableau project Overview
- Expected Outcome of the Project
- Tableau Project Explanation for the Practice Solution
Check out the Video to learn data visualization in Tableau:
Tableau Project for Practices
As a student, tableau practice projects help you excel in the knowledge of various tools and techniques used in data visualization and optimization of the results based on the customer requirements.
No matter if you’ve done any certifications in tableau, or learned it by yourself, having some projects in your hand will surely increase your knowledge, enhance your skills, and make your resume stand out from others.
To learn more about the features and benefits of various tools in tableau, you can check out tableau sample projects on the official website. For this tutorial, we’ll show you how to create tableau projects for practice by importing the data and converting it into actionable insights.
You can download the datasets for tableau projects from the tableau website or get them from the case study done by a business or think tank.
Check out the Tableau interview questions if you’re preparing for a job interview.

Tableau Project Overview
For this project, we’ll be taking tableau sample data sets superstore as our dataset, which you can download from here. But before moving forward, let’s go through the requirements you need to fulfill for this project.
General Requirements
Below are some of the requirements that are generally expected from every dashboard:
- Your dashboard size should be 1250px(width) by 720px(height).
- Must not have more than 5 containers. However, using them at all is completely optional.
- Every filter must have some padding.
- There should be proper formatting.
Business Requirements
- The project should include at least four filters – region, Segment, Sub-category, and category with relevant values.
- The title of your dashboard should represent the project and be appropriate.
- Having parameters would be great as they allow the user to set a range for various measures and see the data as per their requirements.
- Your project must include bullet graphs/charts showing the comparison between primary and multiple secondary measures.
- Proper formatting is another factor that should be focused on. A well-designed report or dashboard will make your visualizations look professional and interactive.
Now that you have an idea of what a project should look like, let’s take the tableau superstore data as our sample dataset and create a dashboard in Tableau Desktop.
You can follow our Tableau tutorial and learn how to install tableau on your system.
Expected Outcome of the Project
The image below shows how the final result of your project should look like in the form of a dashboard. You can also check out the tableau project management dashboard example and other ones from the tableau website and learn how the formatting is done to make the dashboards more interactive and informative.
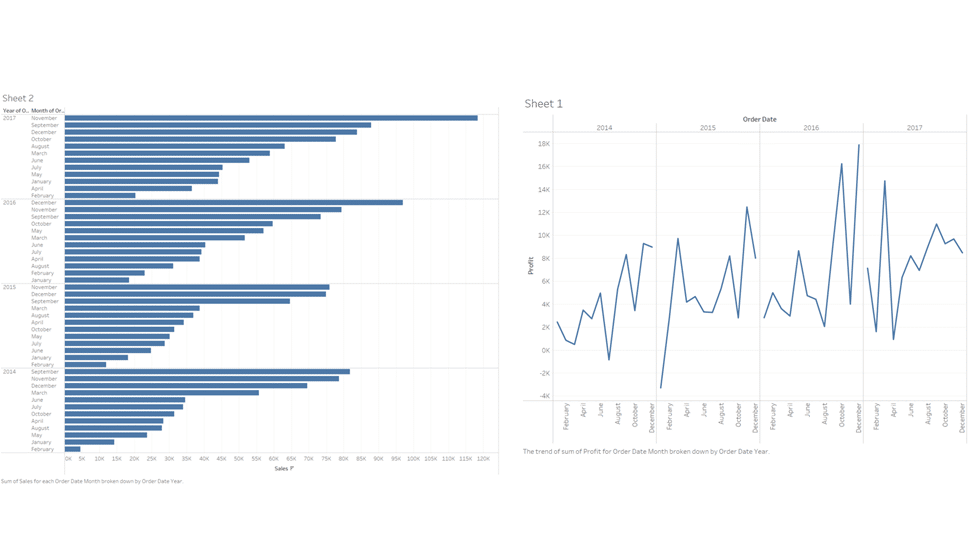
Now, let’s move forward and go through the solution of our tableau project for practice
Take the Tableau online training and learn the core tools used to perform data analysis and visualization projects.
Tableau Projects Explanation for the Practice Solution
There are many tableau projects with examples available on the internet and official websites. Tableau is used by millions of users covering almost every industry. Therefore, the chance of getting tableau practice exercises and dashboards related to your field is very high. Talking about the project, there are a few steps that one should follow while creating a project in tableau.
So, let’s go through these steps and understand what each step does.
Courses you may like
Connecting Data Sources
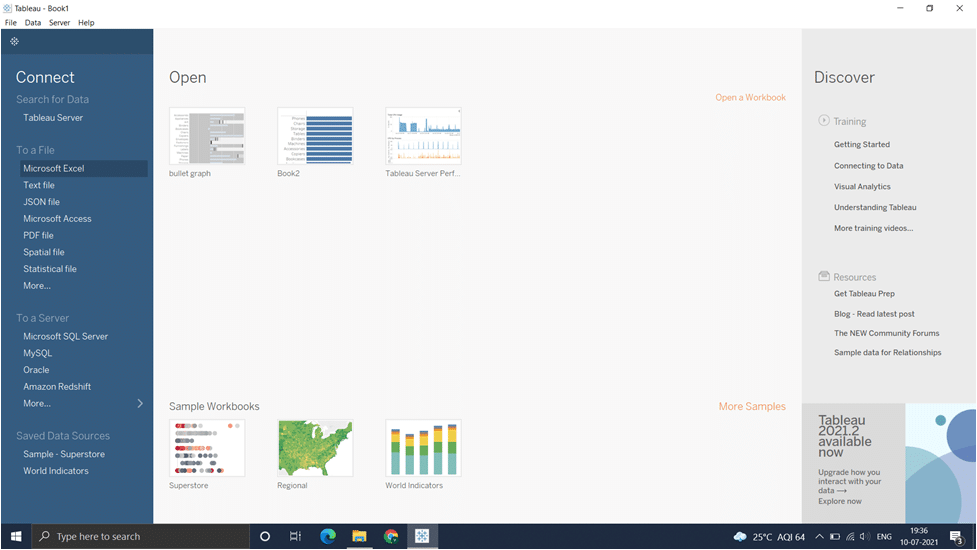
After getting the data from the links mentioned above, the first step is to connect all the data sources from different sources to a single interface. Tableau Desktop allows you to gather data in varied formats like Excel worksheets, CSV files, SQL Server, JSON, and more. To do so, open the tableau desktop and select the superstore excel file.
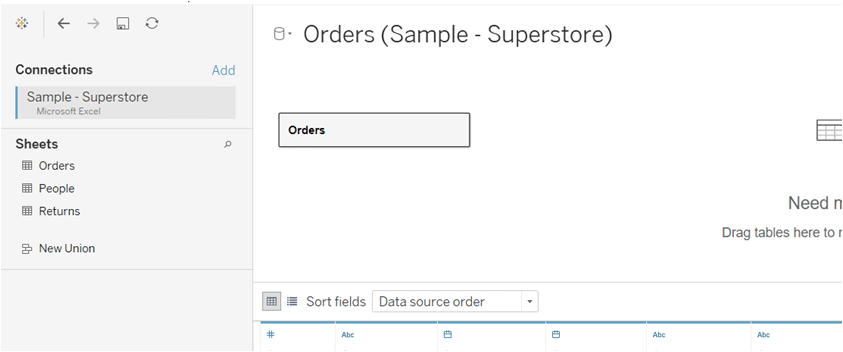
- Once the data is loaded, click on the Order sheet and the data will be connected to the interface.
Create Tableau Worksheet
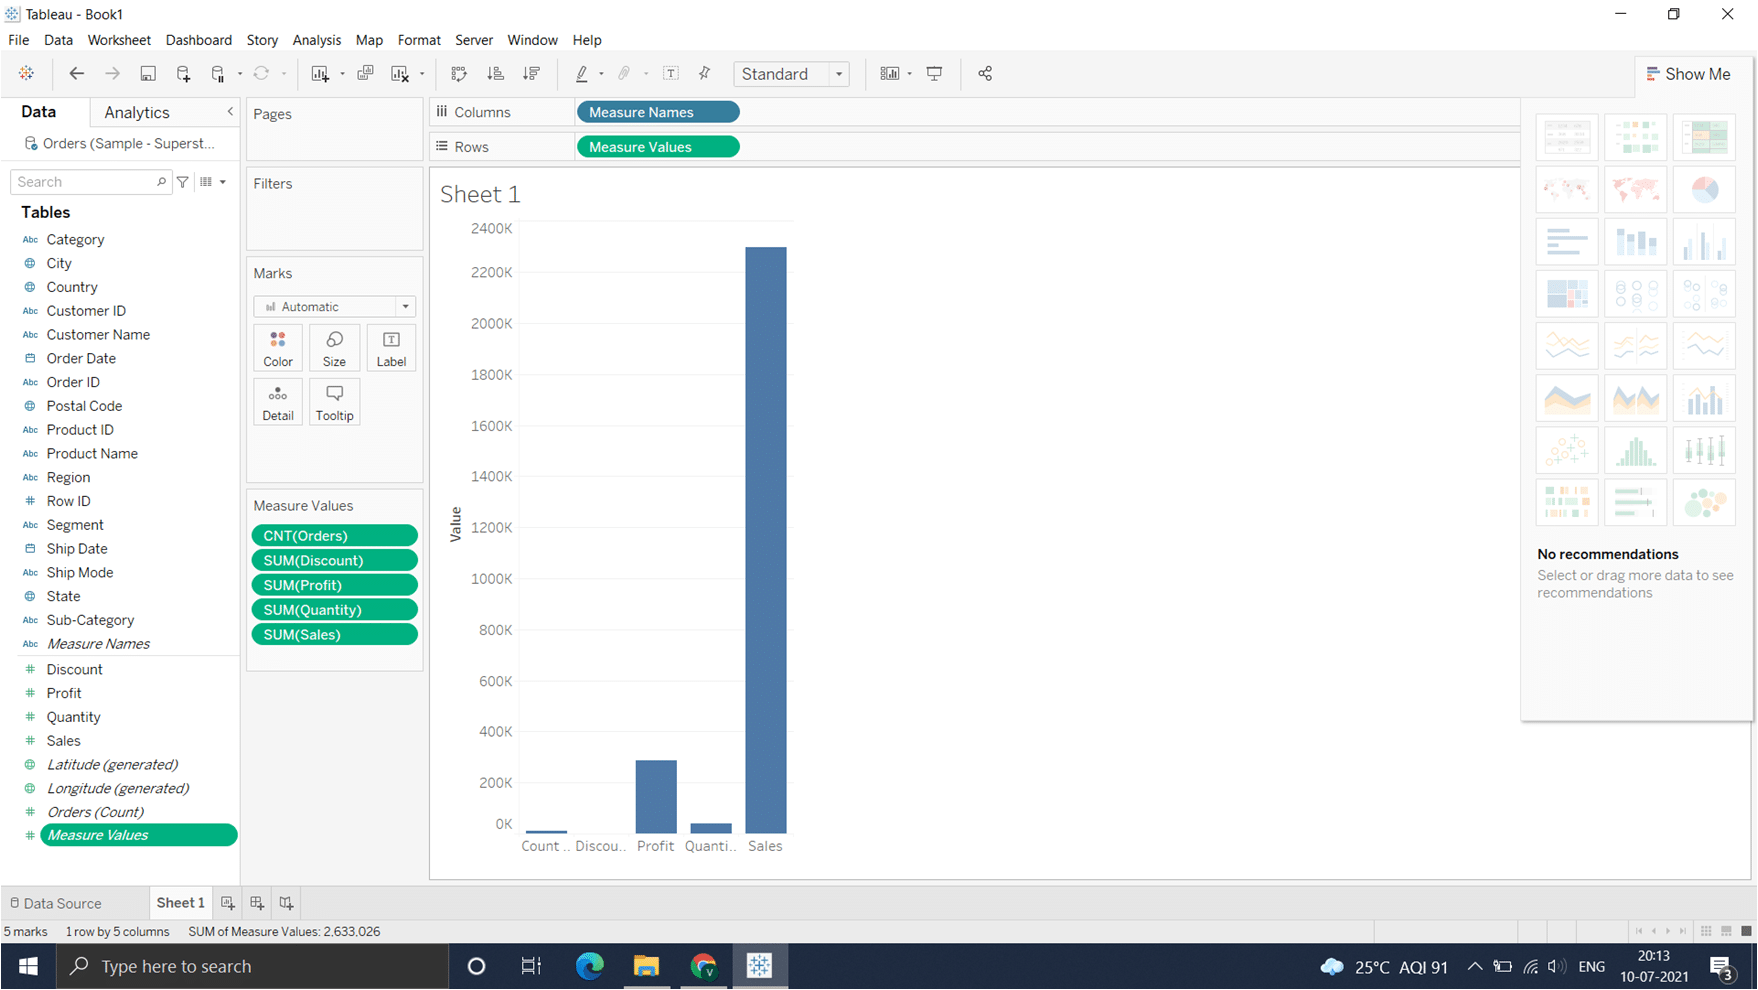
The worksheet contains all the features and visualization options required to build a perfect project. So, go to the bottom left corner of the interface and click on Sheet 1 to create the worksheet. As mentioned in the project requirements, here you can create the measure values and make your data more relatable.
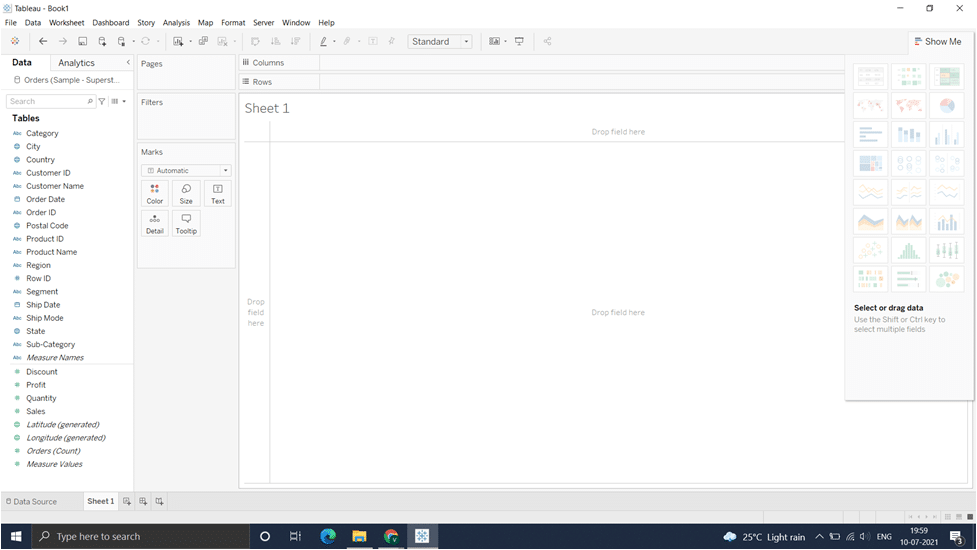
Now, select the Measure value field from the Tables tab under the Data section and all the fields like Orders, Discount. Profit, sales, and quantity on the measure value section. Where you can do the changes as per the requirements of your project.
Add Filters
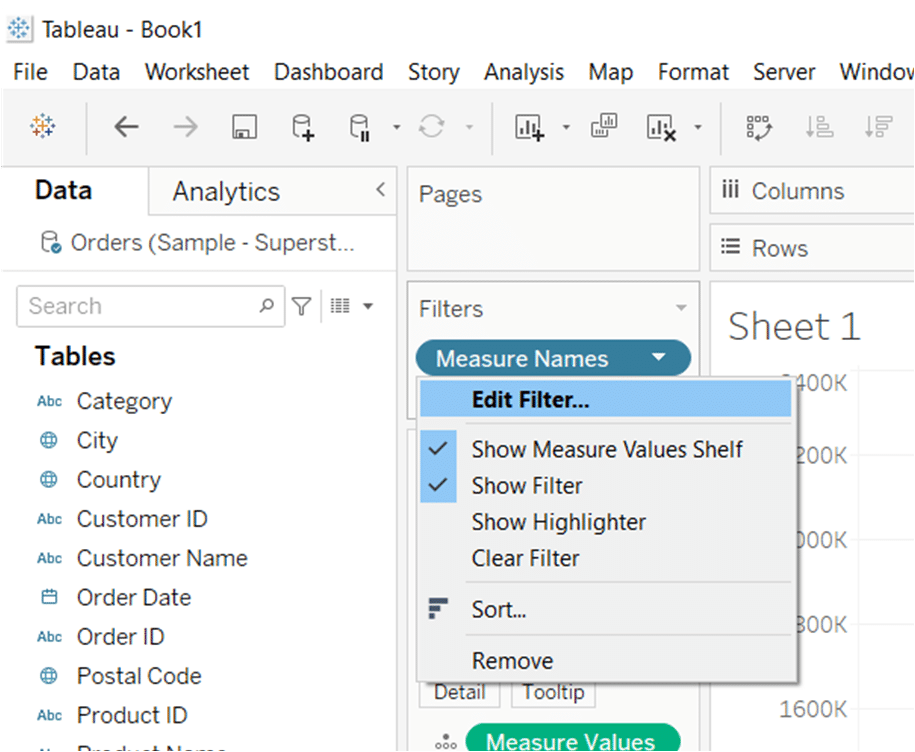
Filters refer to the process of moving some or a range of values from the dataset. In the tableau, you can apply both simple and advanced calculation-based filters based on the scenario. To make the changes in your worksheet, right-click on the Measure Names option and select Edit filters. From there, you can add or remove the filters:
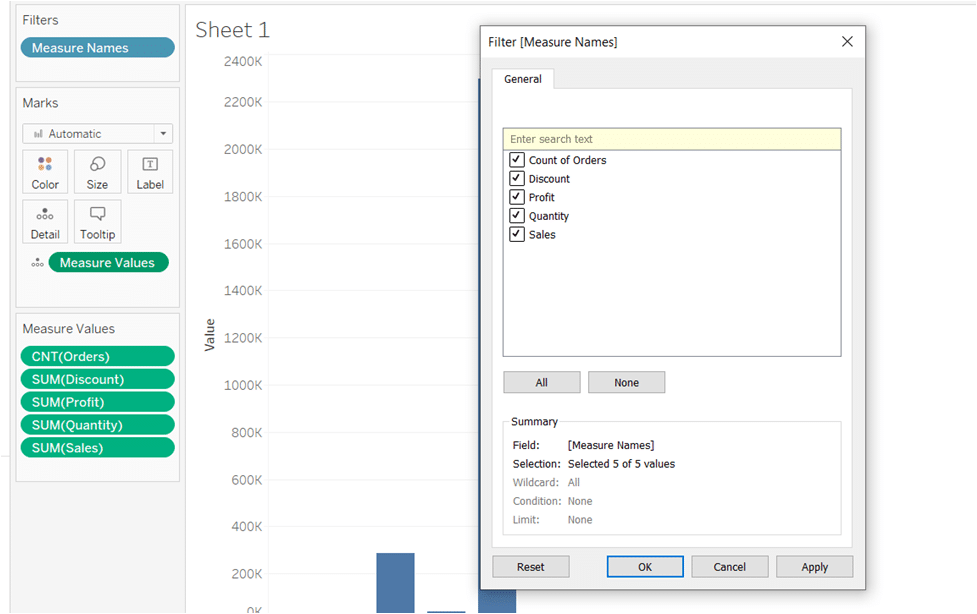
A dialog box will appear with a bunch of options to add or remove a range of values from the filters.
Creating Charts
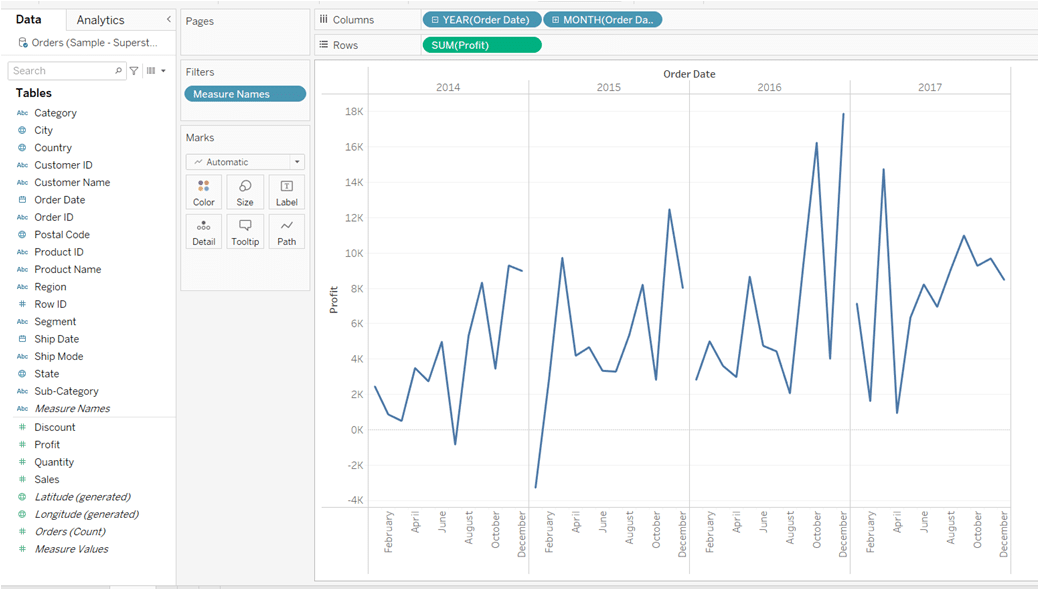
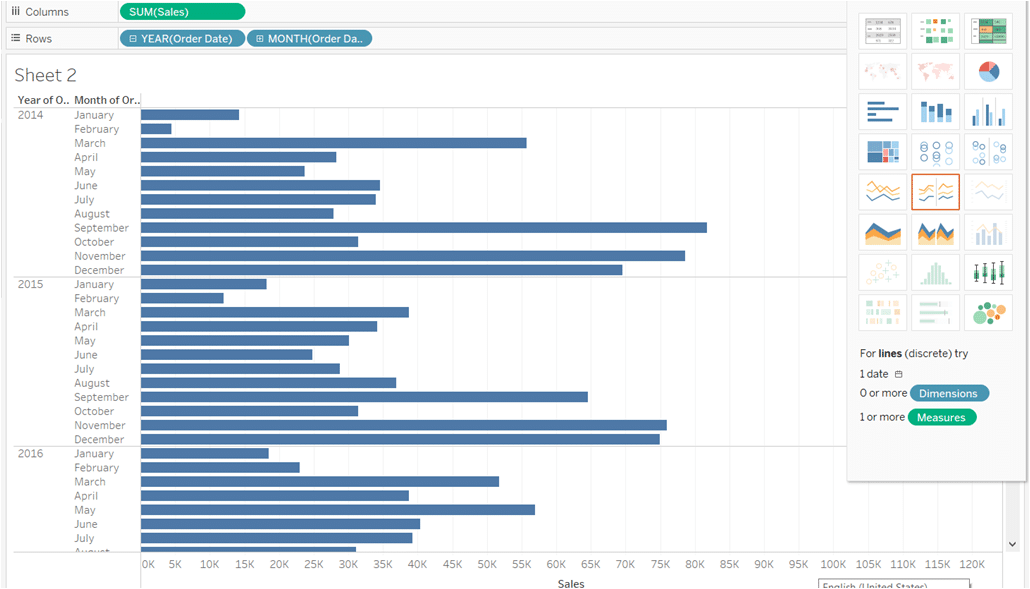
In the next step, we’ll now create the visualizations like graphs, plots, maps, and charts. Tableau charts are one of the most used visualizations by different users worldwide. To create a chart, select the fields from the data panel and then click on the visualization you want to have, from the Show Me panel on the right side of the screen.
For example, let’s create a chart for the total profit on different years along with the profit earned by months on the x-axis.
Similarly, create the horizontal bars or other visualizations for the total sales done every month over a period of time. So, continue with the process and create all the charts you want to include in the dashboard.
Creating the report
After adding all the visualizations and applying the formulas, it’s time to export your work as a report, PowerPoint presentation, worksheet, or dashboard. You can share the output with other users and stakeholders on the internet using Tableau Server. To export the worksheet, got the File section on the top-right corner and select the format you want your data in.
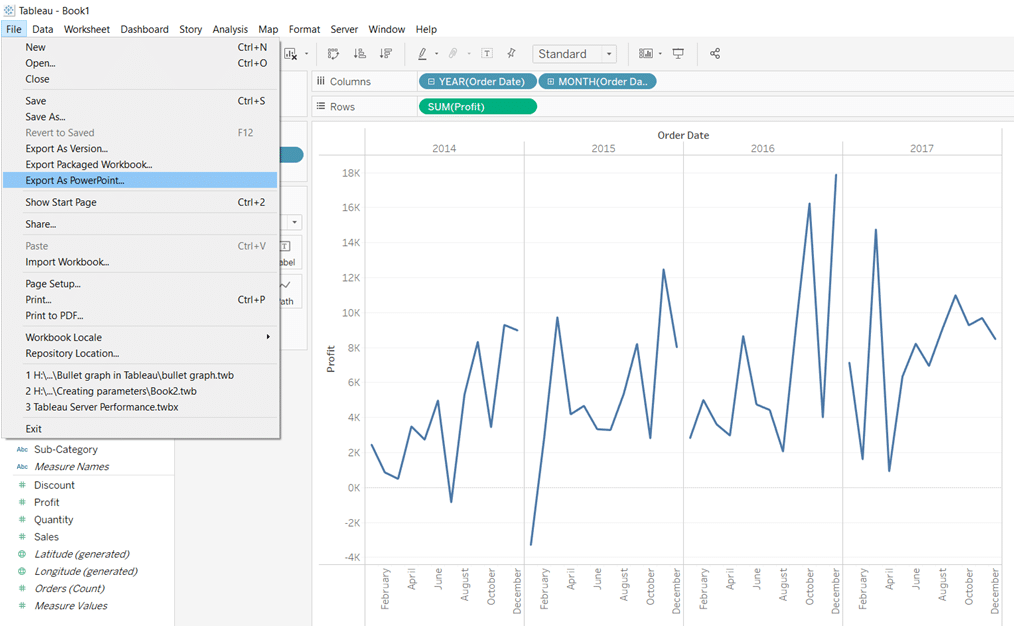
Check the expected outcome section above to the content exported to your device.
Career Transition


Conclusion
So this was all about creating the tableau project for practice. Tableau is one of the best data analytics tools used by thousands of companies across the globe. You can find hundreds of dashboards and worksheets created by companies from different fields.
If you face any problem or have any doubt, then check out our Business Intelligence community and get it resolved.
The post Tableau Projects for Practices: Sample Superstore appeared first on Intellipaat Blog.
Blog: Intellipaat - Blog
Leave a Comment
You must be logged in to post a comment.