
Basic Statistics for Data Science
Glimpse
The primary benefit of statistics is that information is presented in an understandable manner.
Since statistics aid in the selection, assessment, and interpretation of predictive models, it is a crucial prerequisite for applied machine learning and offers a staggering job satisfaction.
Quickly have a look at the topics to be covered in this blog:
- What is Statistics?
- Why Statistics?
- Dictions used in Statistics
- The fundamental Statistics Concepts for Data Science
- Conclusion
This free course will help you dive deeper into the world of Data Science and Machine Learning!
Let’s start our exploration by knowing about Statistics:
What is Statistics?
- A visual and mathematical portrayal of information is statistics. Data science is all about making calculations with data.
- We make decisions based on that data using mathematical conditions known as models.
- Numerous fields, including data science, machine learning, business intelligence, computer science, and many others, have become increasingly dependent on statistics.
Statistics is divided broadly into two categories:
- Descriptive statistics:
Provides ways to summarize data by turning unprocessed observations into understandable data that is simple to share.
- Inferential Statistics:
With the help of inferential statistics, it is possible to analyze experiments with small samples of data and draw conclusions about the entire population (entire domain).
Why Statistics?

- Each and every organization aspires to be data-driven. This explains why the demand for data scientists and analysts is rising so quickly.
Let’s take a few examples of statistics that are used in day-to-day life:
- In the medical industry, statistics are extremely important.
- Scientists must present a statistically valid rate of effectiveness before any drugs are prescribed. Behind every medical study is statistics.
- We often predict the future in daily life.
- As an illustration, when we are uncertain as to whether we will be awake in the morning, we set the alarm.
- Here, we make predictions using the fundamentals of statistics.
- The researcher frequently employs statistics.
- To gather the pertinent data, they make use of their statistical expertise. If not, there will be a loss of resources like time, money, and data.
Dictions used in Statistics
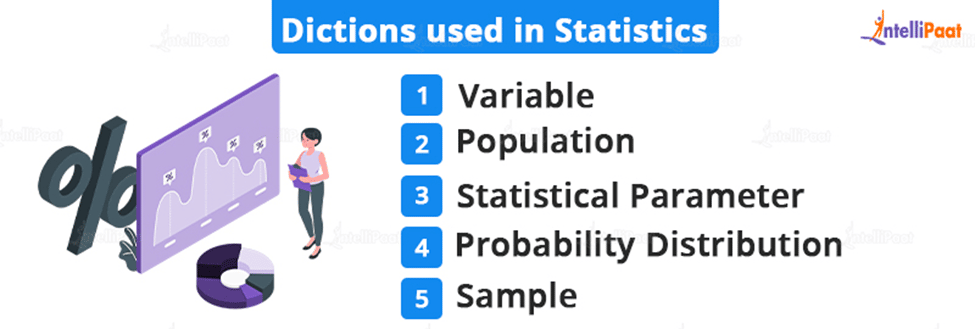
- Variable: A variable is anything that can be counted, be it a number, a property, or another type of quantity. A data point is another name for it.
- Population: A population is a group of resources from which data can be gathered.
- Statistical Parameter: A statistical or population parameter is essentially a measurement that aids in indexing a group of probability distributions, such as the mean, median, or mode of a population.
- Probability Distribution: A probability distribution is a mathematical idea that mainly provides the odds of occurring various potential outcomes, typically for an experiment by statisticians.
- Sample: A sample is simply a portion of the population that is used to sample data and to make predictions using inferential statistics.
Check out the Data Science course on Intellipaat to learn more about data science.
The fundamental Statistics Concepts for Data Science
- Correlation
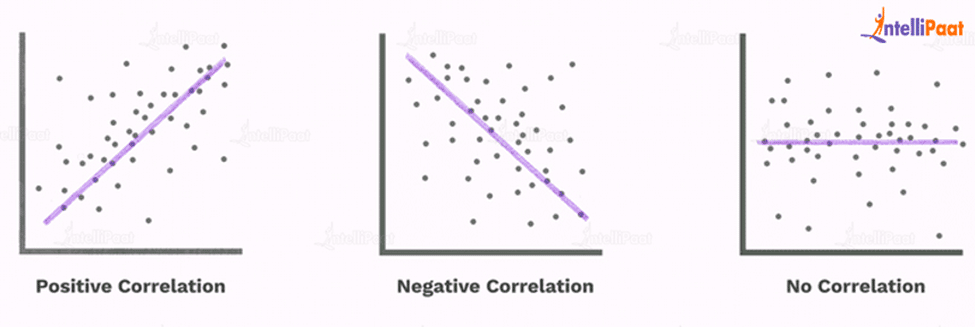
It is one of the most important statistical methods for determining how two variables relate to one another.
The correlation coefficient shows the degree to which two variables have a linear relationship.
- Indicating a positive relationship is a correlation coefficient greater than zero.
- Indicative of a negative relationship is a correlation coefficient that is less than zero.
- A zero correlation coefficient denotes the absence of any correlation between the two variables.
- Regression
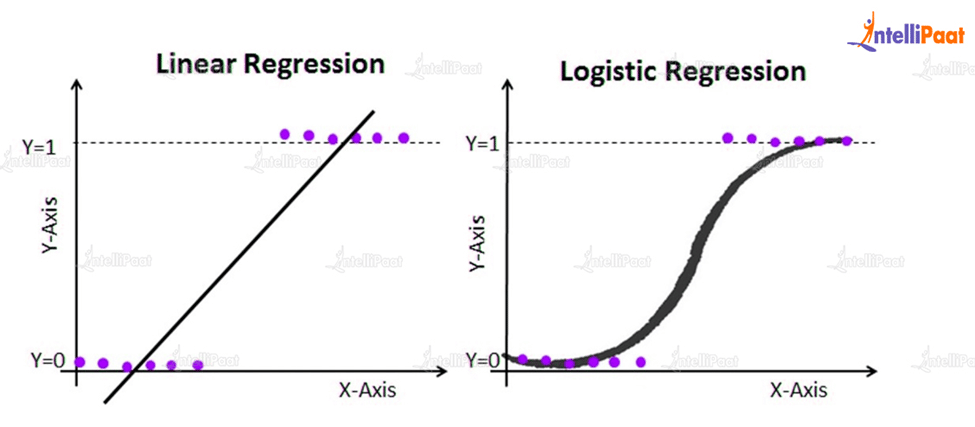
It’s a technique for figuring out how one or more independent variables and a dependent variable relate to one another.
There are mainly two types of regression:
- Linear regression: An explanation of the relationship between a numerical predictor variable and one or more predictor variables is provided by a regression model using linear regression.
- Logistic regression: Regression models that describe the connection between the binary response variable and one or more predictor variables are fitted using the technique of logistic regression.
For more information on Data Science Tutorial, see our blog post on the subject.
- Bias
When a model is representative of the entire population, in terms of statistics, it means that. To achieve the desired result, this must be minimized.
The following are the top three forms of bias:
- Selection bias:
Selection bias is the phenomenon of choosing a group of data for statistical analysis in a way that prevents the data from being randomly chosen, making the data unrepresentative of the entire population.
- Confirmation bias:
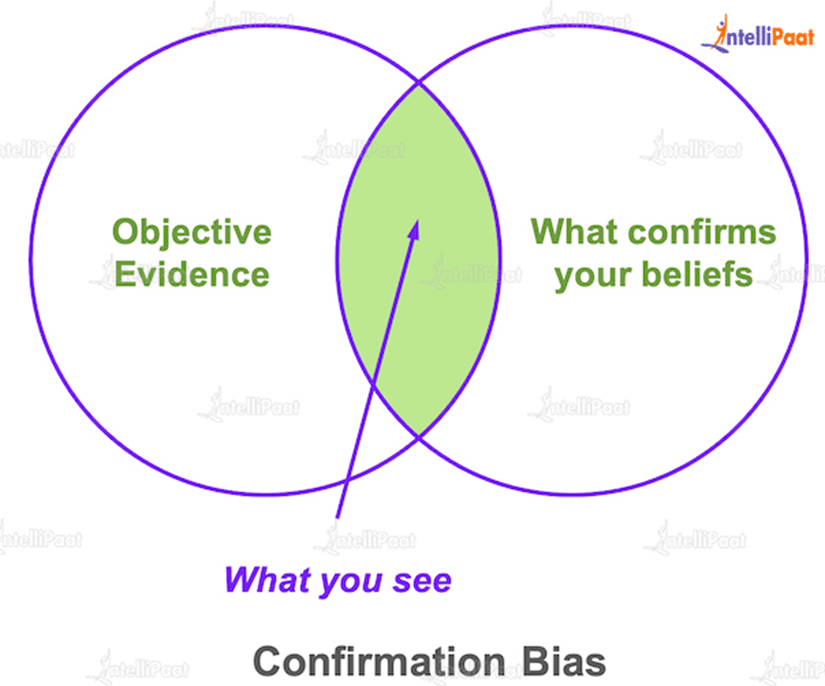
Confirmation bias is a problem that arises when a statistical analyst uses data to support an assumption that is already held to be true.
Time interval bias is when a certain time frame is purposefully chosen to favor an outcome.
- Distribution of Possibilities
All potential events’ probabilities are specified. An event is simply the outcome of an experiment, like tossing a coin.
There are two categories of events:
- Dependent
- Independent
- Dependent Event:
When the occurrence of the event depends on earlier events, it is said to be dependent.
As in the case of drawing a ball from a bag of red and blue balls.
Depending on the outcome of the first trial, the second ball drawn may be red or blue if the first ball is red.
- Independent Event:
The term “Independent event” refers to an event that is unaffected by earlier events.
When flipping a coin, for instance, let’s assume that the first outcome is head and that the second outcome could be either head or tail.
However, the first trial has no bearing whatsoever on this.
Examine the Data Science Interview Questions and Answers to succeed in your interview.
- Statistical Analysis
It is used to describe the fundamental characteristics of data that give an overview of the provided data set, which may represent the entire population or a sample of the population.
It is obtained through calculations that comprise:

- Mean: Also referred to as the arithmetic average, the mean is the central value.
- Mode: The value that appears the most frequently in a data set is referred to as the mode.
- Median: The median is the ordered set’s middle value that divides it in half exactly.
- Regular Distribution
For a continuous random variable in a system, the probability density function is defined as normal.
The mean and standard deviation, two variables that make up the standard normal distribution, were previously covered.
The normal distribution is used when there is no way to predict how random variables will be distributed.
The use of the normal distribution in these circumstances is justified by the central limit theorem.
- Variability
The following parameters are included in variability:
- Percentile: In statistics, this term refers to the measurement that shows the value below which a given percentage of observations in a dataset falls.
- The statistic known as standard deviation determines how widely spaced out a data set is from its mean.
- Range: The difference between the largest and smallest values in a dataset is how this term is defined.
- Variance is a statistical term that describes the range of values in a data set. It generally refers to the deviation from the mean.
Career Transition


Conclusion
We use sets of mathematical equations called statistics to analyze data. We are continuously informed of events taking place around the world.
Since much of the information we encounter today is derived mathematically, statistics play a crucial role in our lives.
It means that accurate information and statistics concepts are essential.
Still in doubt? Contact us at our Community Page!
The post Basic Statistics for Data Science appeared first on Intellipaat Blog.
Blog: Intellipaat - Blog
Leave a Comment
You must be logged in to post a comment.