US Credit Quality Rising … The Beat Goes On
Blog: Enterprise Decision Management Blog

When I last blogged about the national distribution of FICO® Scores a year ago, US consumer credit quality was continuing to climb upwards, though with some potential indications of change ahead. At the end of that post, I asked: has the 7+ year upward trend started to level off? 12 months later, the answer is a resounding “no”!

The number of consumers scoring in the super-prime range of 800 or above has continued to grow. In October 2015, this figure surpassed 20% of the national population for the first time since we’ve been tracking this metric, dating back to pre-recessionary 2005. In the subsequent six months, the figure continued to climb, reaching 20.4% as of April 2016.
Inversely, we see fewer consumers scoring in the lowest score ranges. As of April 2016, just 20.7% of the population score 600 or below. This figure peaked shortly after the Great Recession, at a value of 25.5% in October 2010. Our research shows that over the subsequent six years, more than 17.5 million consumers raised their score above the 600 threshold.
That said, some of this trend may be a result of the lowest-scoring consumers “dropping out” from traditional credit usage, and by extension no longer having valid FICO® Scores. Another increasingly relevant explanation is that we are now seven years past the nadir of the Great Recession in 2008-2009, when we saw a spike in derogatory events such as foreclosures and defaults. Per Fair Credit Reporting Act (FCRA) mandate, all derogatory payment information must be purged from the credit file no later than seven years after the negative event occurred. Thus, a significant number of the millions of consumers who experienced foreclosure, default, etc. during the downturn may be seeing those negative marks drop off their credit files.
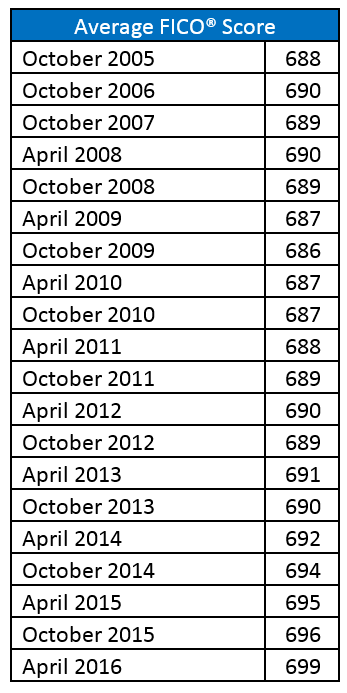
In a similar vein to the score distribution results, the national average FICO® Score is currently at an all-time high—almost 10 points above what it was just prior to the recession in October 2006. In last year’s blog post, I wondered whether this upward trend was starting to flatten out. The April 2016 figure puts this theory to rest, posting a three-point improvement over the national average FICO® Score from just six months prior.
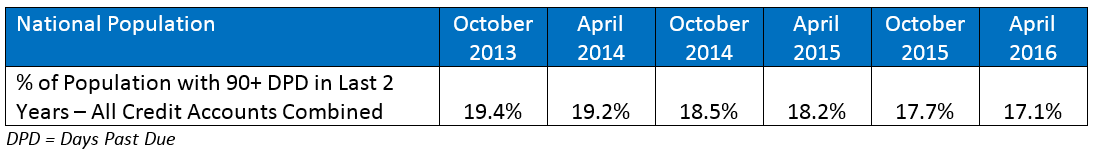
To round out our picture of US credit health, we examined trends in consumer repayment and delinquency. As we saw last year, there continues to be a steady decrease in the percentage of consumers with recent serious delinquencies (defined as 90+ days past due)—from 19.4% in October 2013 to 18.2% in April 2015 to 17.1% in April of this year. Since payment history comprises roughly 35% of the overall FICO® Score calculation, this sustained reduction in delinquency is clearly a key driver of the ongoing upswing in the FICO® Score distribution.
We further examined these delinquency trends by credit product. Once again, we see a continuation of the trend we saw last year, with the overall decrease in serious delinquencies largely driven by the real estate segment. The latest data shows real estate delinquency continuously declining, while bankcard delinquency rates have leveled off at 7.1%. If anything, auto loan delinquency rates are inching ever so slightly upwards, having increased to 4.9% in April 2016, compared to a rate of 4.6% one year ago.

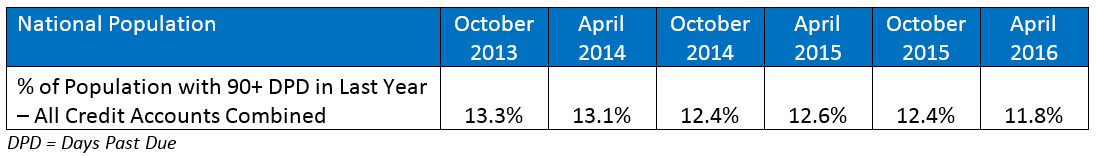
In last year’s blog entry, when we shifted to a shorter term 12-month view of delinquency trends, we observed a slight uptick in serious delinquency rates on the most recent data. At the time, we didn’t have sufficient data to know if this was a one-time blip or an early warning of an inflection point in consumer repayment behavior. Now, with the added insight of two subsequent data snapshots, the April 2015 observation appears to have been merely a pause in the overall delinquency trend. The one-year delinquency rate has subsequently dropped from 12.6% in April 2015 to 11.8% in April 2016.
All in all, these results are good news, showing US consumer credit quality has maintained its slow-and-steady rise. The FICO® Score distribution continues to trend upwards, driven largely by low rates of default across credit cards and other consumer loan products.
There is a danger, however, of looking at these results with rose-colored glasses. While they speak to how well US consumers are, on average, managing their financial health, there are numerous exogenous factors to the credit report that ultimately drive consumers’ ability to pay their credit obligations; these include macroeconomic factors such as unemployment and fluctuation in the Home Price Index, interest rates, and even changes in product features offered by lenders (e.g., the exotic ARM products that spiked in popularity in the run-up to the subprime mortgage crisis).
The question prudent lenders should now ask is: “How long can this trend go on?” At what point will delinquencies—currently at record lows over the recent past—start to increase?
Even when US credit quality is healthy, lenders should not abandon smart underwriting practices, which means factoring into their credit decisions all of the “four Cs:” credit, capacity, collateral and conditions (including economic factors). The industry would be well-served by following the classic adage: “Hope for the best but be prepared for the worst.”
The post US Credit Quality Rising … The Beat Goes On appeared first on FICO.
Leave a Comment
You must be logged in to post a comment.