Unstoppable Renewables Fostering Re-foundation of Power Markets
Blog: Capgemini CTO Blog
Capgemini has recently published the nineteenth edition of its annual study, which for the first time goes beyond Europe and becomes the World Energy Markets Observatory report (WEMO 2017). Some key learnings regarding the renewables sphere are proposed here.
More with less
In five years the landscape of power generation has drastically changed. In 2016, the 162 GW of new renewable capacities accounted for 55 percent of all new power capacity installed in the world during the year and for 90 percent in Europe. Onshore Wind, PV and Offshore Wind are definitively the winning technologies with growth rates of the cumulated fleet of 16 percent, 33 percent, and 30 percent, respectively, per annum over the five past years. For the first time, more solar capacity was added (71 GW) than any other technology.
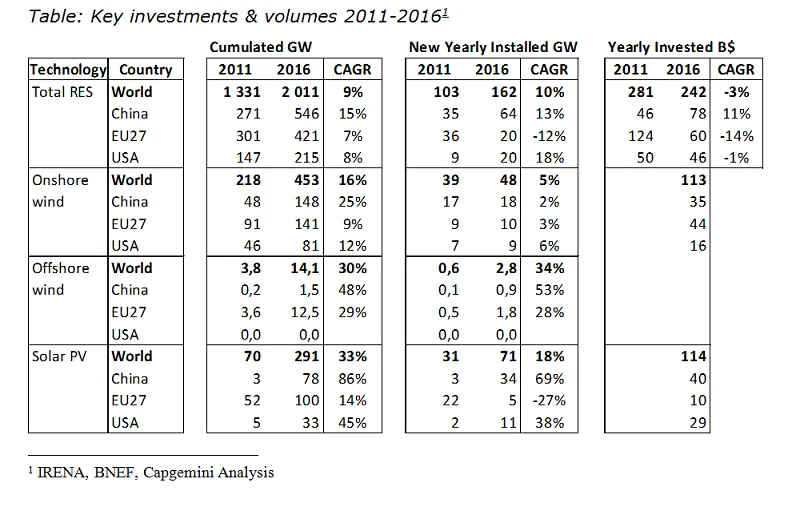
As BNEF stated, before 2011 more renewable capacities were achieved with more investments; since 2011 more capacities added with stable or even lower investments (-3 percent compound annual growth rate or CAGR). China is now a major investor with $78 billion per year, European investments are now stable at around $60 billion per year, and the USA, used to up and downs, record significant investments in 2016 ($48 billion).
Getting closer to cost competitiveness, when not already cheaper
Indeed, during the past 12 months, the costs of renewable energies have continued to fall: onshore wind and utility scale photovoltaic (PV) costs are becoming competitive in some countries, compared to traditional electricity generation resources (nuclear, coal, gas).
Utility scale solar PV cost now range in the US at an average of $55 per MWh. In Europe, auctions were awarded at 90 euros per MWh in 2015. It decreased in the recent tenders in 2017 down to 65€/MWh in Germany and 55€/MWh in France. Records have been hit in a tender in Saudi Arabia, where the winner won with a $17.9/MWh bid, the second offered $22.36/MWh, and the third $26.6/MWh, all below the previous $30/MWh record.
Onshore wind is still the cheapest technology, with an average LCOE in the US of around $45/MWh (32-62)², records being hit in Morocco below $30/MWh.
Offshore wind has seen unexpected cost cuttings. In UK both Moray and Hornsea 2 projects were awarded at a price of 65€/MWh, well below the 105€/MWh of Hinkleypoint C project, therefore fostering debate. In Germany bidding prices of 44€/MWh for completion between 2021 and 2025 have been accepted, with first offshore wind farms to be built without subsidies.
Battery energy storage ready for market take-off
Battery pack costs fell from 1000 $/kWh in 2010 to 200-300 $/kWh in 2016. Costs are believed to decrease below 200 $/kWh in 2020 down to 75-100 $/kWh by 2030, Tesla betting on heading to this level before 2025.
At the end of 2016, energy storage installations in Europe were estimated at 370 MW/520 MWh, doubling 2015 levels. In 2016, UK’s National Grid awarded 700 MW of battery storage contracts, while in July 2017, Australia’s Prime Minister announced that the world’s largest lithium ion battery (100 MW capacity) would be built by Tesla. In Hawaii, Tesla’s Kapaia installation includes a 13 MW solar system and 52 MWh of batteries (4 hours deepness), delivering electricity at USD139/MWh, already competitive against fossil generation.
Additional grid costs do not change the picture
Additional investments in grid reinforcement and smarter grids development can be estimated to an average of 15% to 40% of the generation investment, at least in advanced economies where networks are already existing and where consumption is more or less flat from now on. When power consumption is growing quickly, an admitted rule of thumb derived from 1970-2000 analysis in western countries is that 0,5-1$ has to be invested in grid development for 1$ of additional generation.
Even so, renewables become cost competitive in many countries compared to fossil-generated power without any public intervention.
Written by Philippe Vié and Alain Chardon.
This article first appeared in Electric Light & Power on January 29th, 2018.