
Uncover Insights from your API Ecosystem
Blog: The Tibco Blog
Reading Time: 3 minutes
In today’s IT landscape, application programming interfaces (APIs) are a key component to any digital transformation or modernization initiative. However, APIs are much more than just an IT tool used to connect assets. APIs allow you to model your entire business digitally and expose it to external and internal API consumers to access and engage with through mobile or web devices. This capability fundamentally changes how customers, partners, and even employees engage with your business and helps you achieve a variety of strategic business goals, including seamless interoperability, increased business agility, and more efficient use of resources.
API-led integration has grown in popularity and is likely a key component of your business’s modernization or transformation strategies. However, can you accurately measure the impact of your API program on your business? Most API analytics dashboards focus exclusively on the technical performance of APIs at the expense of metrics focused on the business value of your program.
Unlock Business Insights with a Consolidated Analytics Dashboard
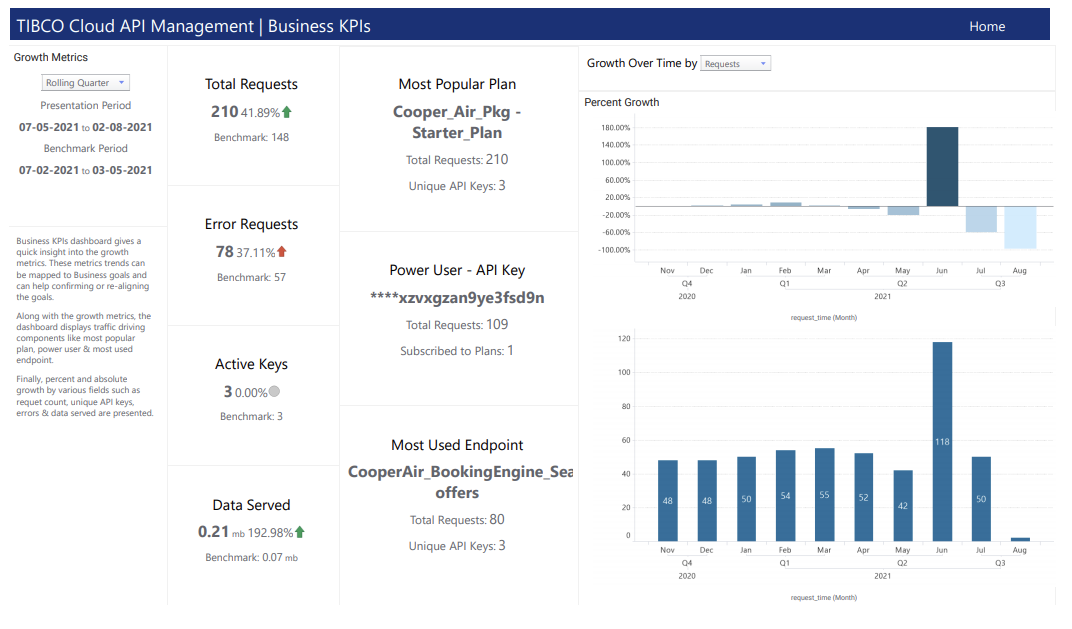
TIBCO offers a consolidated monitoring dashboard that provides both technical and business-oriented metrics so you can measure the overall performance of your API program and uncover opportunities to create additional value. You can easily access the API Analytics dashboard—created with TIBCO Spotfire—through the embedded TIBCO Cloud Integration Marketplace. This dashboard allows API Management users to take advantage of TIBCO’s advanced visual analytics capabilities so you can minimize the time between business events and business insight.

The Business KPI (key performance indicator) view shown above gives a quick snapshot of critical API ecosystem metrics, with metrics to help you measure your API program’s growth and identify your most popular assets and active users. You can dig deeper in additional views, which provide detailed information on your API traffic, giving you a full picture of which APIs are driving value and have been successfully adopted in your ecosystem and which ones may need to be reevaluated. This information helps you measure the overall success of your API program and identify future areas of investment to drive your program forward.
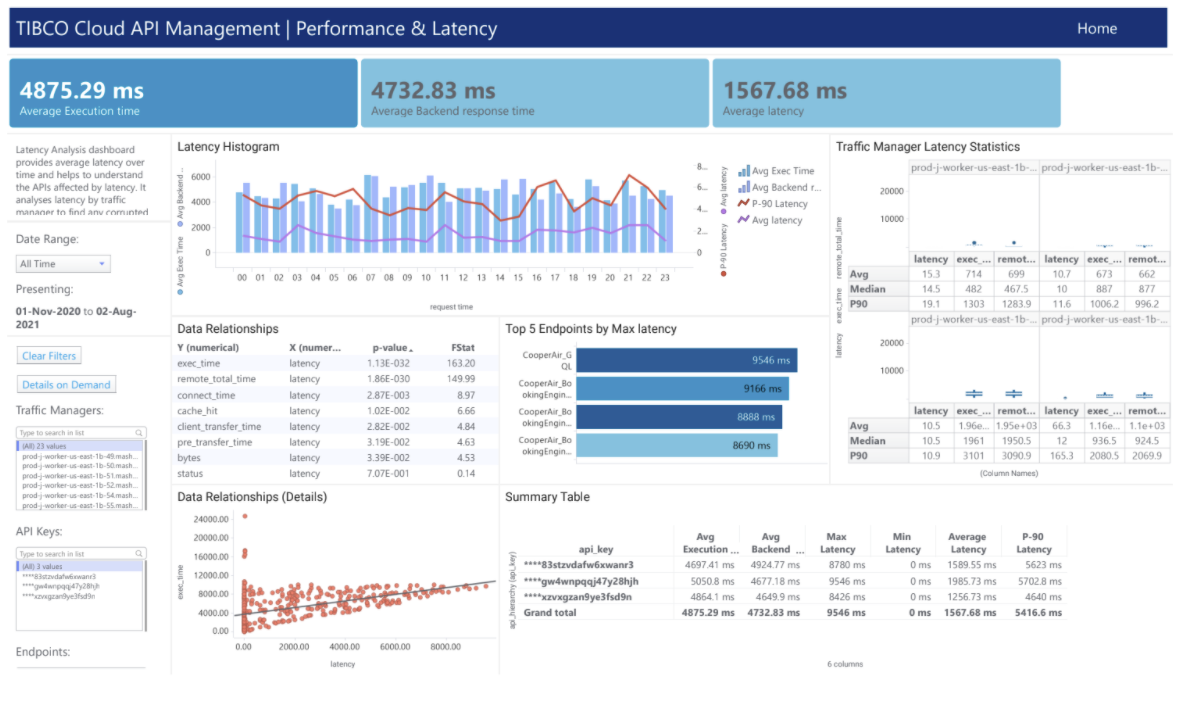
Other dashboard views allow you to dig into performance issues so you can reduce the risk of business disruption by easily identifying underperforming APIs and investigating root causes.
The Response and Error Codes view allows you to analyze API errors so you can quickly find the error source, such as non-performing endpoints, a faulty traffic manager, and more. The Performance and Latency view shown above provides detailed latency metrics so you can understand your latency over time and quickly identify APIs with significant time delays. It even analyzes latency by traffic manager so you can quickly find and address corrupted traffic managers.
Most API analytics dashboards focus exclusively on the technical performance of APIs at the expense of metrics focused on the business value of your program.
Click To Tweet
For additional guidance on how to successfully implement an API program, check out the Ultimate Implementation Guide to API Management. The guide provides three simple steps for implementing a successful API program, best practices for implementing an API-first strategy, and examples and worksheets to accelerate your API transformation journey.
The post Uncover Insights from your API Ecosystem first appeared on The TIBCO Blog.
Leave a Comment
You must be logged in to post a comment.