Spotfire Tips & Tricks: Hierarchical Cluster Analysis
Blog: The Tibco Blog
Hierarchical cluster analysis or HCA is a widely used method of data analysis, which seeks to identify clusters often without prior information about data structure or number of clusters. Strategies for hierarchical clustering generally fall into two types: Agglomerative and divisive. Agglomerative is a bottom up approach where each observation starts in its own cluster, and pairs of clusters are merged as one moves up the hierarchy. Divisive is a top-down approach where all observations start in one cluster, and splits are performed recursively as one moves down the hierarchy.
Hierarchical cluster analysis in Spotfire
The algorithm used for hierarchical clustering in TIBCO Spotfire is a hierarchical agglomerative method. For row clustering, the cluster analysis begins with each row placed in a separate cluster. Then the distance between all possible combinations of two rows is calculated using a selected distance measure. The two most similar clusters are then grouped together and form a new cluster. In subsequent steps, the distance between the new cluster and all remaining clusters is recalculated using a selected clustering method. The number of clusters is thereby reduced by one in each iteration step. Eventually, all rows are grouped into one large cluster. The order of the rows in a dendrogram are defined by the selected ordering weight. The cluster analysis works the same way for column clustering.
Distance measures: The following measures can be used to calculate the distance or similarity between rows or columns
- Correlation
- Cosine correlation
- Tanimoto coefficient
- Euclidean distance
- City block distance
- Square euclidean distance
- Half Square euclidean distance
Clustering methods: The following clustering methods are available in Spotfire
- UPGMA
- WPGMA
- Single linkage
- Complete linkage
- Ward’s method
Spotfire also provides options to normalize data and perform empty value replacement before performing clustering.
To perform a clustering with the hierarchical clustering tool, Iris data set was used.
Select Tools > Hierarchical Clustering
Select Data Table, and next click Select Columns
Sepal length, Sepal Width, Petal Length and Petal width columns were selected
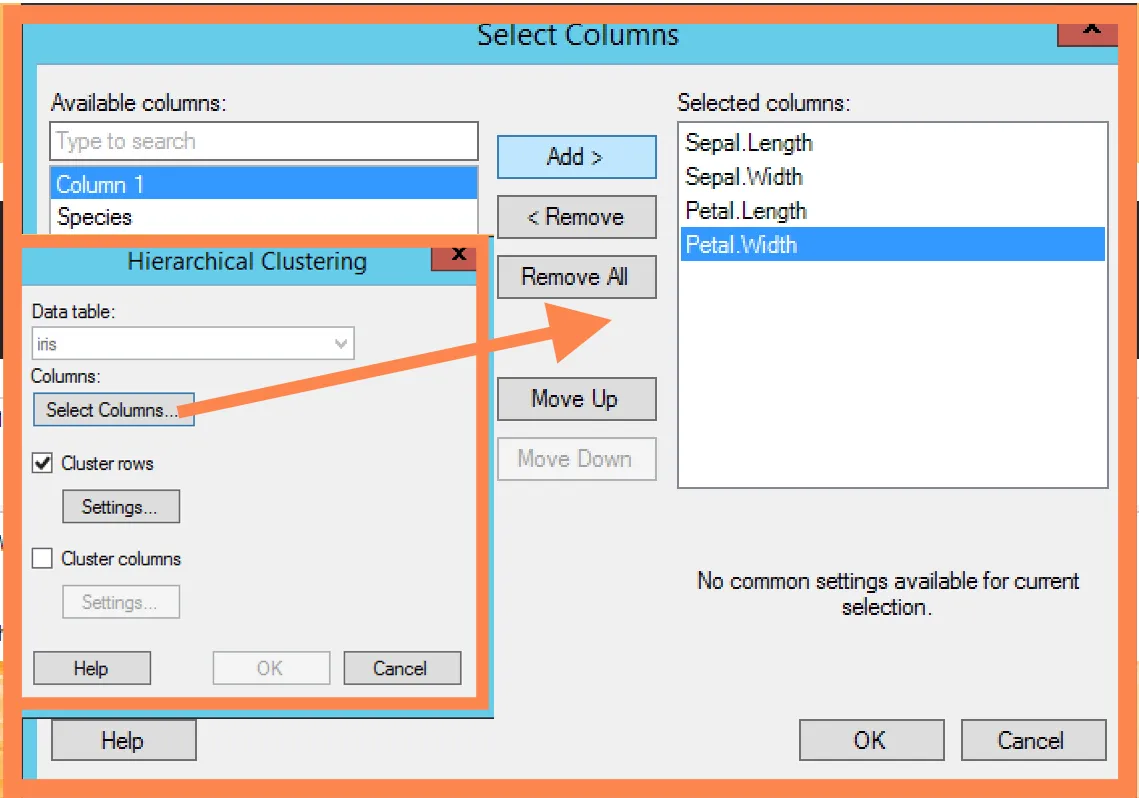
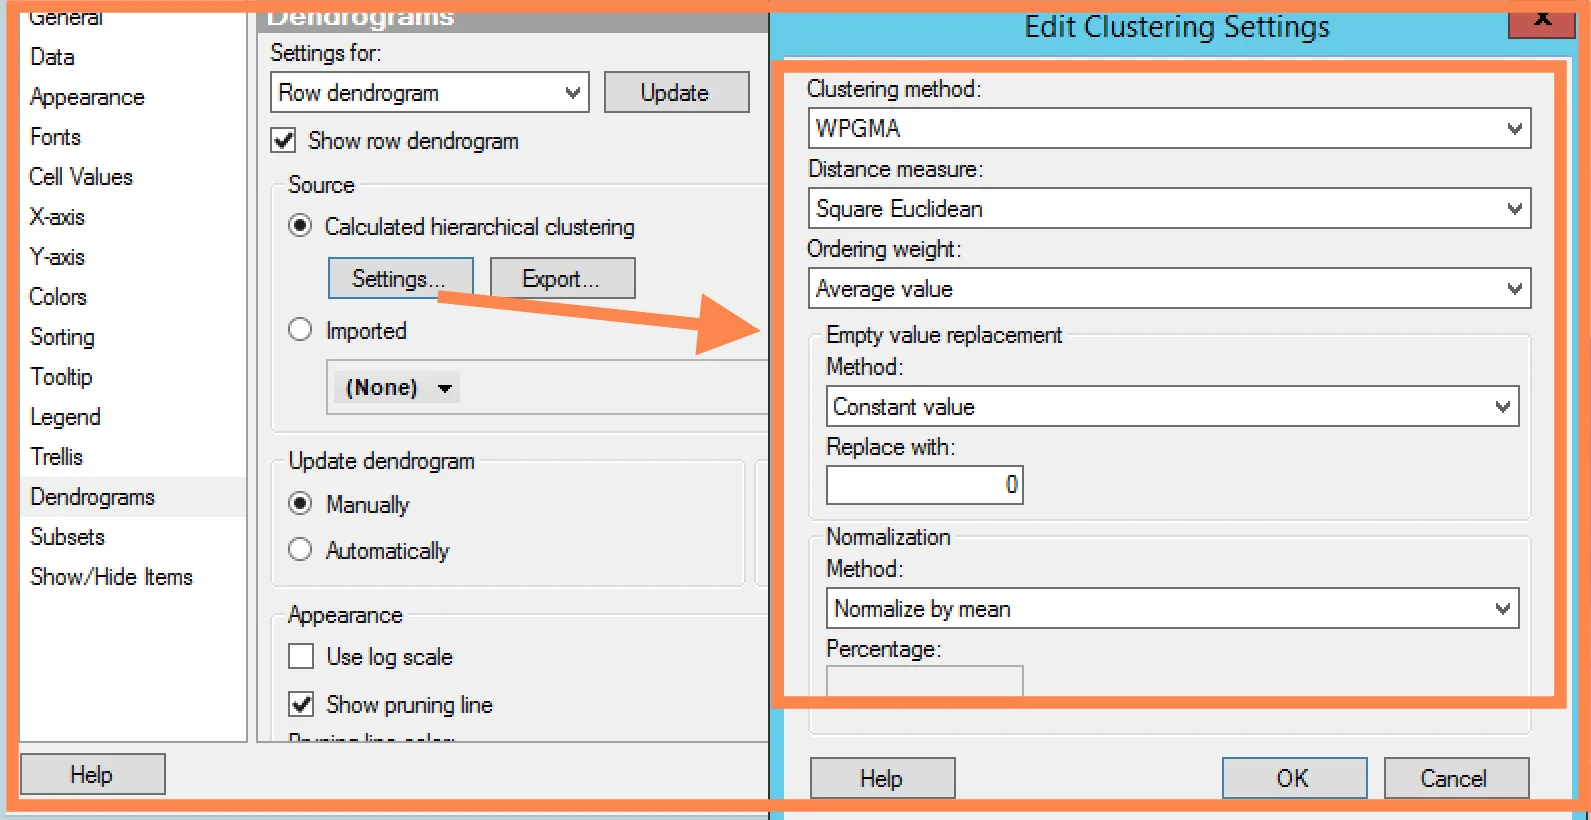
Next, in order to have row dendrograms, Cluster Rows check box was selected
Click the Settings button to open the Edit Clustering Settings dialog and select a Clustering method and Distance measure. In this case default options were selected.
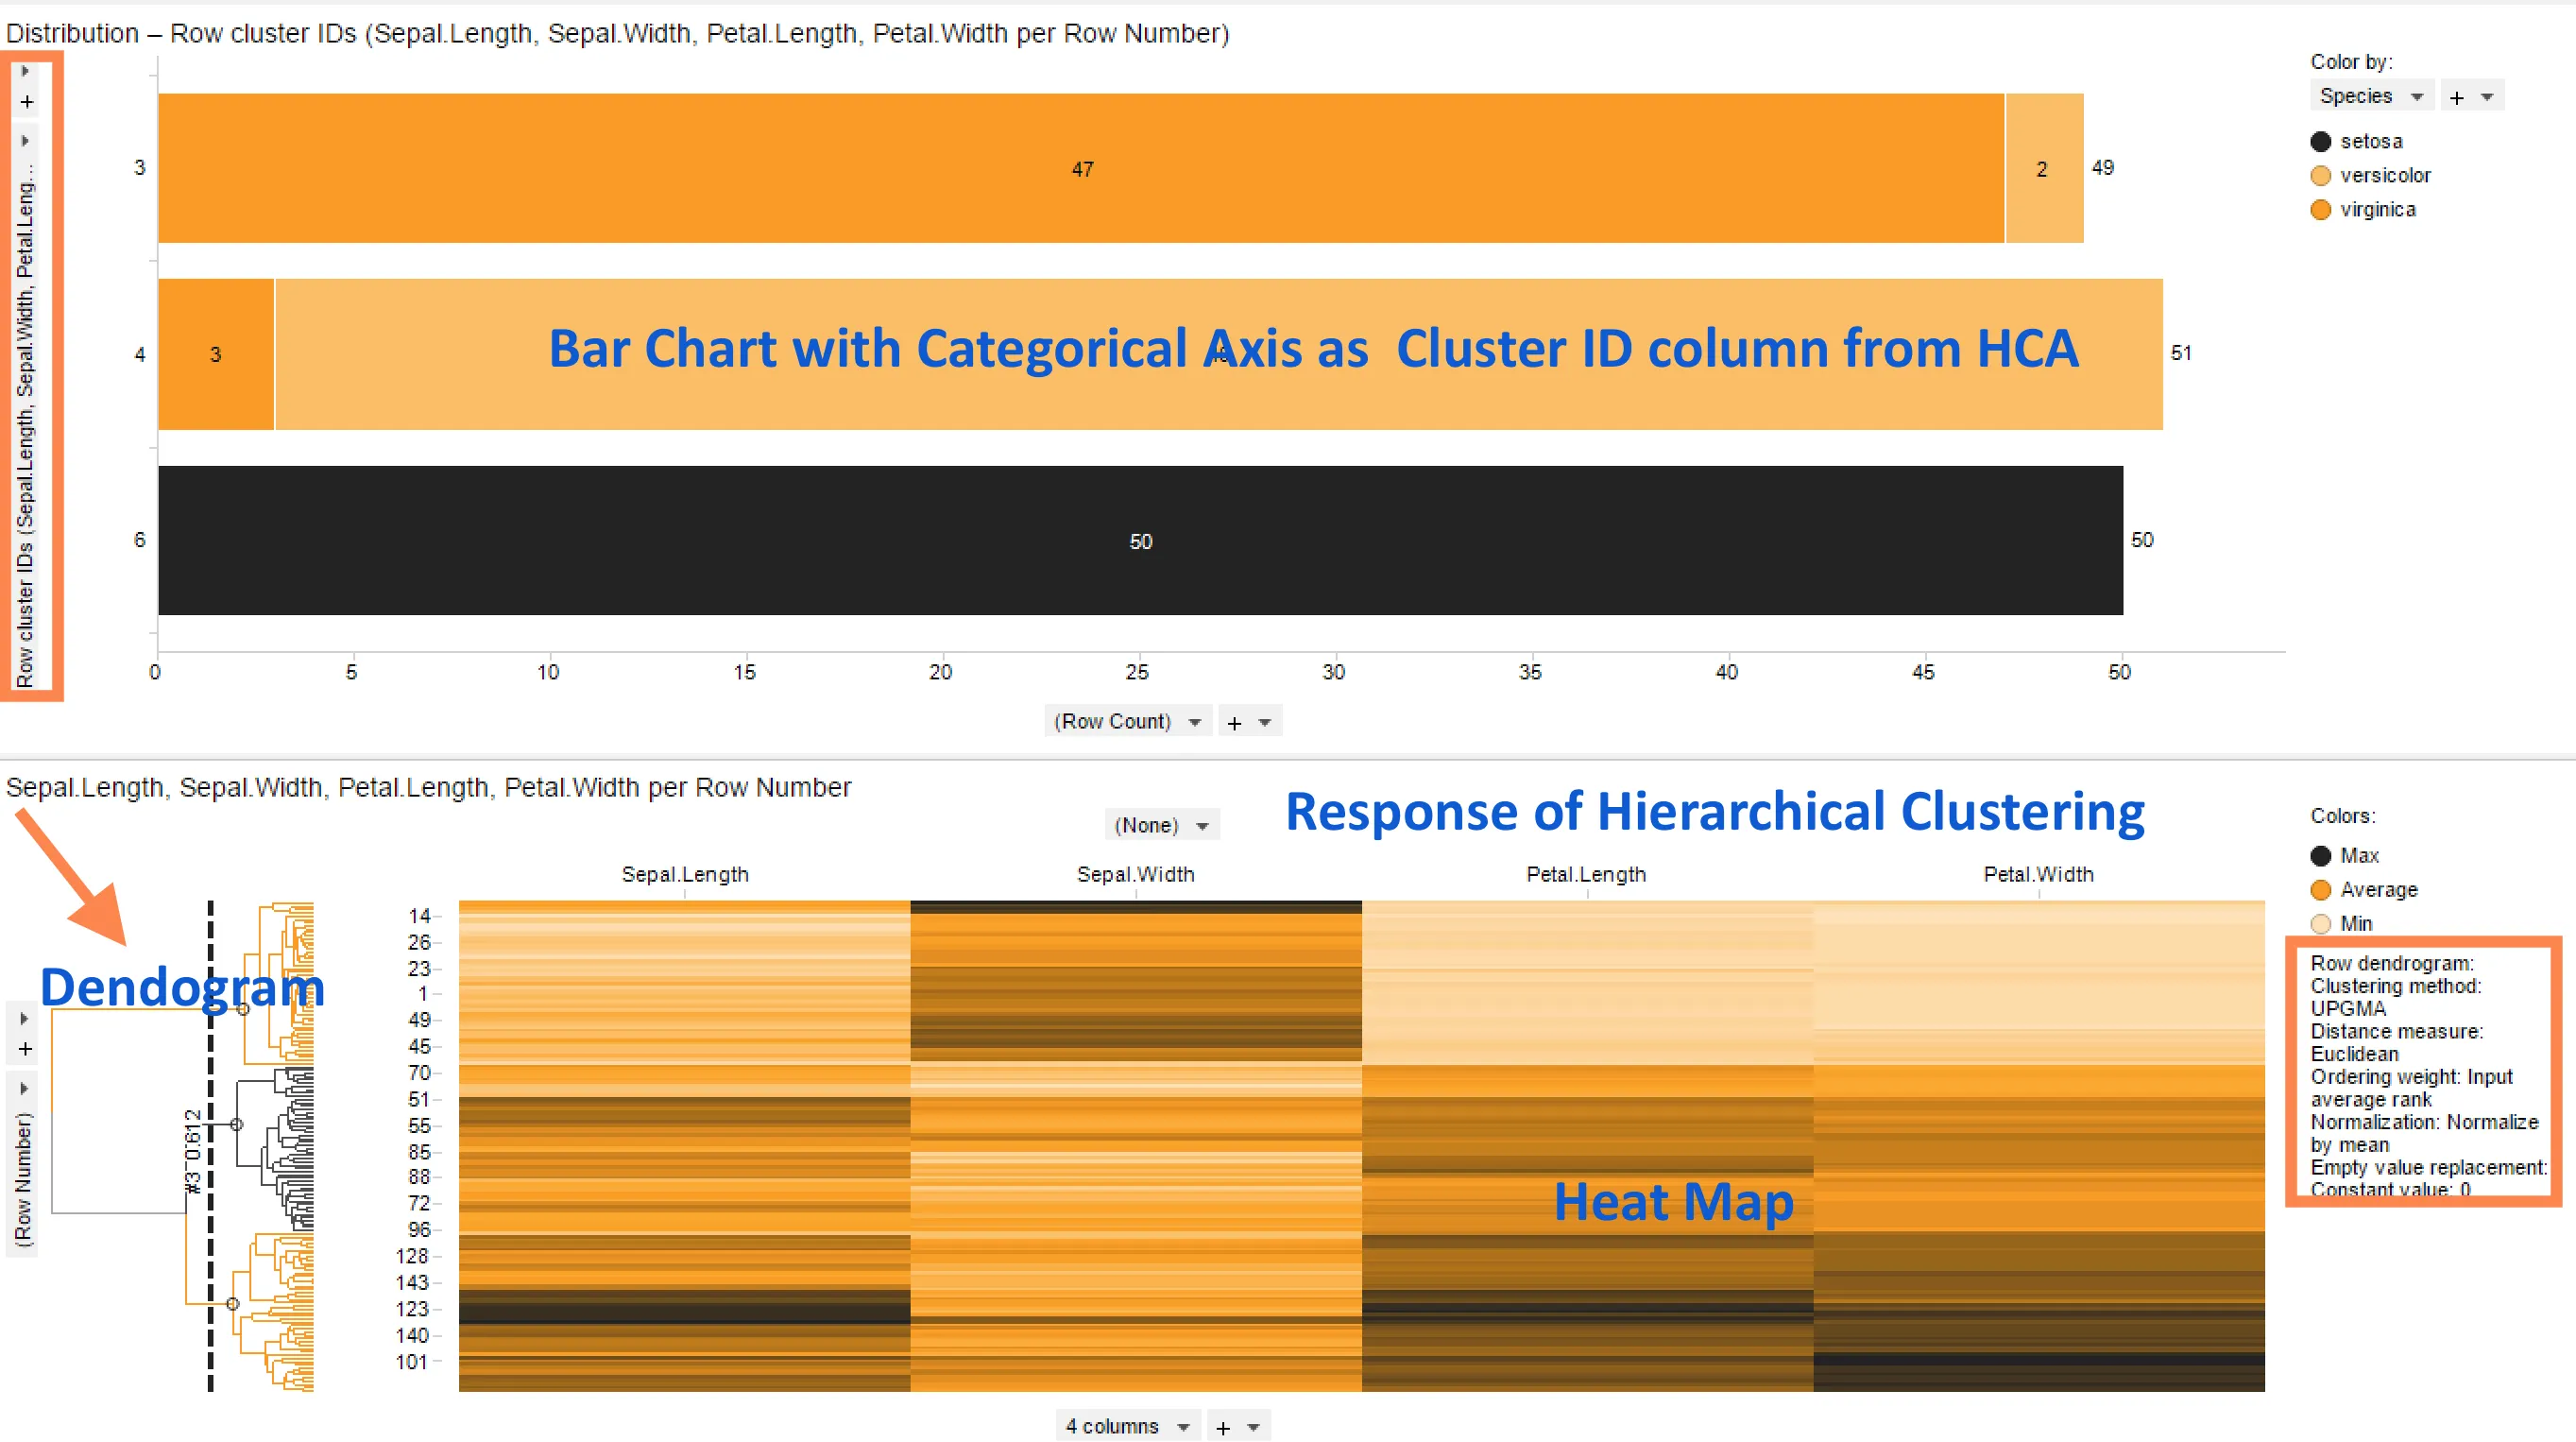
The hierarchical clustering calculation is performed, and heat map visualization with the specified dendrograms is created in just a few clicks. A cluster column is also added to the data table and made available in the filters panel. The bar chart uses cluster ID column to display species. The pruning line was set to 3 clusters and it is observed that Setosa was predicted correctly as single cluster, but there were some rows in Virginca and versicolor which were not in right cluster and these are known issues.
Try this for yourself with TIBCO Spotfire! Test out a Spotfire free trial today. Check out other Tips and Tricks posts to help you #DoMoreWithSpotfire!