
Smart grid or silly tube maps?
Blog: Capgemini CTO Blog
It was only in 1931, decades after major parts of the London underground had been commissioned, that Harry Beck designed the first version of the iconic London Tube map. The officials of the London Underground organization were skeptical at first, but later came to embrace the simplified, schematic overview of their infrastructure after its immense success with the public.
Everyone who uses a public transportation system such as the London Underground intuitively understands the value of a network model and its graphical representation. Hence, it is a good illustration of what electrical, hydraulic, and telecommunications network models should look like in providing an illustration for navigating and understanding the big picture, the network.
As Harry Beck said: “If you’re going underground, why do you need to bother about geography? It’s not so important. Connections are the thing.” And indeed, the essence of a good network model is that it serves its functional purposes. The function of a public transportation “asset system” is to allow people to travel efficiently and safely through a city or country. The representation of the network as a topological graphic enables that transportation function and particularly supports individuals in planning their journey along different “nodes” and connecting lines.
The business rules that govern the way a trip can be planned must be a part of the network model. Even if two distinct nodes in a network are located on the same geographic position, that does not necessarily mean there is a connection from one node to another. A connection is subject to connectivity rules and thus may or may not exist, be temporarily out of service or disrupted, etc. There may even physically be a service corridor between two stations, that is closed for passenger transits and therefore is not a “link” of the system. One-way streets are a good example of a connectivity rule allowing traffic in one direction only. Bridges are a good example of connections that cross each other but are not connected.
Similarly, the network models of water, wastewater, energy and telecommunications companies must be “smart” in the sense that they functionally describe how flows can logically be managed over the asset system in accordance with the (hydraulic or electrical) business rules that are either imposed by nature (gravity for instance) or by design (load capacity for instance).
A schematic graph with some simple annotations is the best way to represent linear asset systems (networks). But inevitably they embed a huge (over)simplification of reality, by omitting much of the topographic and physical detail that operators need to build, maintain and operate these systems.
Thanks to the popularity of the London tube map, a graphic arts community creates artist variations of the map, sometimes referred to as “silly tube maps” as many of them are humoristic. But some of them show relevant information that is not represented on the tube map, such as the “it’s quicker to walk” tube map with 500m walk lines or the actual underground map in the figure below showing that only 39% of the Underground are actually underground (grey areas on the map).
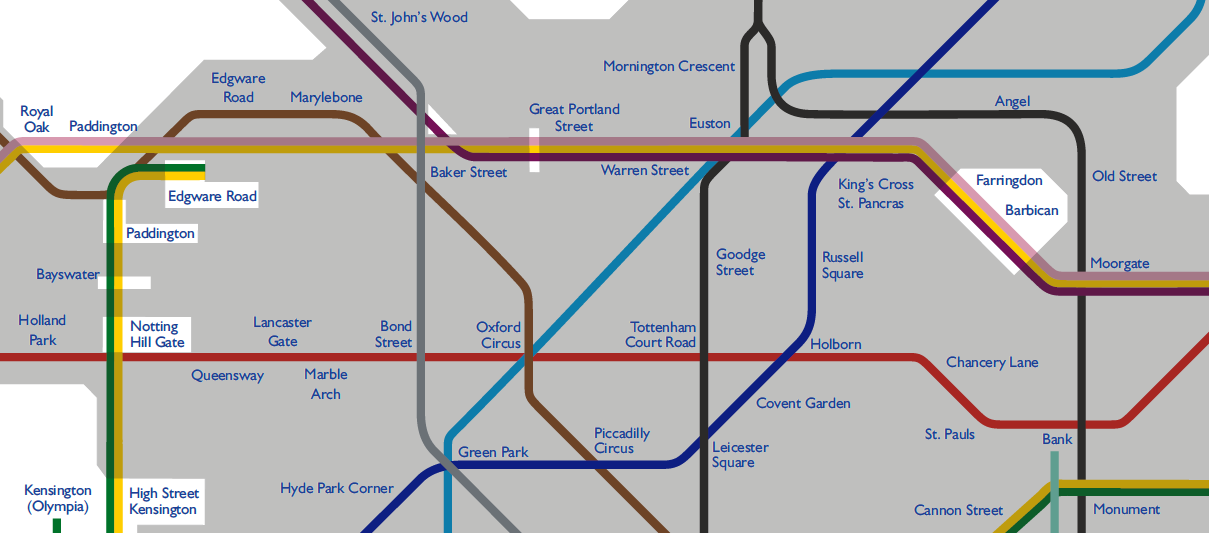
These representations are not as silly as they seem to be. Suppose there is a major incident on a line between two stations, it will make a huge difference in emergency response if the line is under the ground or above ground. Controlling the risk of flooding in tunnels through preventive and corrective maintenance of pumping installations requires information about the topography, the detailed layout of the tracks, and information about the primary asset system (metro network) as well as secondary assets (water drainage and pumping) to be correct and available.
Millions of commuters experience the facility of a clear network model daily and are guided through the stations to find connected lines. Technicians in manual switching operations and outage management are very much like commuters using a metro network. They have a high-level schematic view of the network, but once arrived in the station they need communication with dispatchers operating the network, seek support from in-plant signage, additional paper documents, or their own experience at the site to take the right action. And what they decide and execute is coordinated with dispatchers through oral communication via radio.
Much of this operation is only possible because knowledgeable people have access to asset system information and can take informed decisions based on what they know and see. But very often they must rely on several information sources without having a common end-to-end view of the network context.
It is clear that a smart grid operation, where much of the manual switching activities will disappear, requires more solid asset and asset system records, including much of the business rules that regulate the integrity of the network and its digital equivalent and automate much of the information lifecycle.
Many of these organizations will have to establish more than one network model i.e., across MV and LV networks for example. A smart grid is connected “live” and thus next to the primary asset system (gas, electricity, rail, etc.) operators will find themselves managing a secondary asset system for telecommunications. This requirement will become critical as water and energy networks become increasingly smart with embedded smart devices that themselves have networks of connected smart devices to read, aggregate data and at the “edge” control, and operate the networks.
Even in existing operations, multiple network models are not an exception. Gas and water companies essentially have a primary hydraulic network for the transport of water, wastewater, or gas. These networks are represented by a network model. But most of the water and gas systems also have cathodic protection networks to control static electricity of the gas or water distribution mains.
A cathodic protection network follows electrical rules and its model should therefore be constructed with a different information model and business rules although some of the equipment (steel pipes serve as electrical conductors) may be part of different networks simultaneously.
Each cathodic protection system contains several measurement devices, electrically connected to the water pipes, that must support a strict monitoring protocol. A single device that is not functioning in a compliant way, may imply a manual re-assessment of the whole cathodic protection “asset system.” Therefore, companies need the cathodic protection system model to identify non-compliant cathodic protection in their network: areas where the network is insufficiently protected against electrolytic corrosion.
A sewage network operator may want to separate collectors for “black” wastewater (heavily polluted and collected for anaerobic treatment) from “grey” wastewater (transported to an aerobic treatment facility). Both networks are and must be separated, hence they have a separate network model that must be hydraulically consistent with sewage engineering principles. But here, the same information model and set of business rules will apply for the two networks, one of the key rules being that the black network may not be connected to the grey network.
Under the pressure of regulators looking at network performance or forced by public opinion looking at sustainability and good governance, companies start to understand that digital transformation is not just a matter of digitizing processes and people activities but rethinking the network itself and its digital twin.
A next contribution will illustrate what’s so special about modelling asset systems, and how the engineering focus on asset systems should be distinguished from the logistics of building and maintaining individual assets. Once this explained, it will become intuitively clear what the role of different IT components (GIS/EAM/analytics) should be.
This blog is part of a series of 6 under the theme “Asset Systems for the Smart Grid”:
- What is an asset system for a network company?
- Smart grid or silly tube maps?
- What’s so special about asset systems?
- What’s so spatial about asset systems?
- Wearables, whereabouts and roundabouts
- What happens on the asset system, stays on the asset system
Author

Jan has more than 20 years experience in GIS (Geographical Information Systems) and asset management projects in utilities (water, electric, gas), telecom and the public sector (transportation, cadastral services).