
Process Mining in Healthcare Case Study No. 3

This is a guest post by Pavlos Delias from the Kavala Institute of Technology in Greece, who shared a summary of his latest process mining case study for you here on our blog.
As we have seen in previous case studies, healthcare processes usually have a high variability in their flows due to the highly customized medical guidelines and the unique path followed by each patient. Therefore, methods to simplify the discovered process flows are needed.
You can read the full scientific article here1.
The analyzed Process
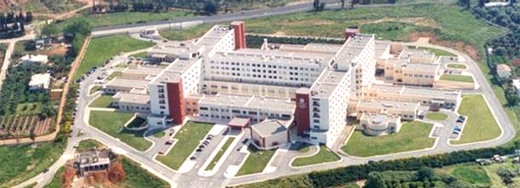
The General hospital of Chania is the unique hospital of the prefecture, serving 67,000 citizens. It is a 400 bed hospital providing all types of health services. The management committee of the hospital asked the research team to analyze their emergency department process.
The manager of the emergency department (who is a doctor) described the process verbally as follows:
The Hospital has two Emergency Departments (ED). The first one, ED1, runs 16 hours per day and the second one, ED2, 24 hours per day. Generally, patients that arrive between 08:00 and 23:00 have to pass through registration. Depending on the triage (red cases = extremely important), patients can skip registration and examination at ED1 and are sent directly to ED2.
When patients arrive at the emergency department prior to 23:00, they have to register at the registration office in ED1. The patients will provide information like their name, age, etc., and have to pay 5 euro for the examination. Afterwards, they have to wait at the waiting room. A nurse will ask the patient about their problems and will characterize the level of the triage. The patients that arrive by the ambulance are sent directly to ED2. Furthermore, patients with urgent problems, like, for example, cardiological incidences or serious accidents, receive the highest priority level (red) and are sent directly to ED2.
The process scope at ED2 is twofold. Firstly, patients who enter the emergency department of the hospital after 23:00 will be served by ED2 because ED1 is closed. Secondly, the normal ED2 process treats patients that face serious problems with their health (belonging to the yellow and red scale of triage). When a patient enters the room of diagnosis the nurse will check the temperature, blood pressure, and heartbeat. Then the physician will provide an initial examination. Depending on the level of triage, a patient waits for the lab results at the waiting room or in bed.
When the physician delivers the results of the examination, there are three possible next steps. If the case is serious, the patient is sent to the appropriate department of the hospital. Alternatively, the patient may receive a prescription and is sent back home. The third choice is to decide that the patient will stay at the wards of the emergency department in order to make more lab tests.
The research team drew a flow chart based on this description, which was confirmed as the expected process flow for the emergency department (see figure below).
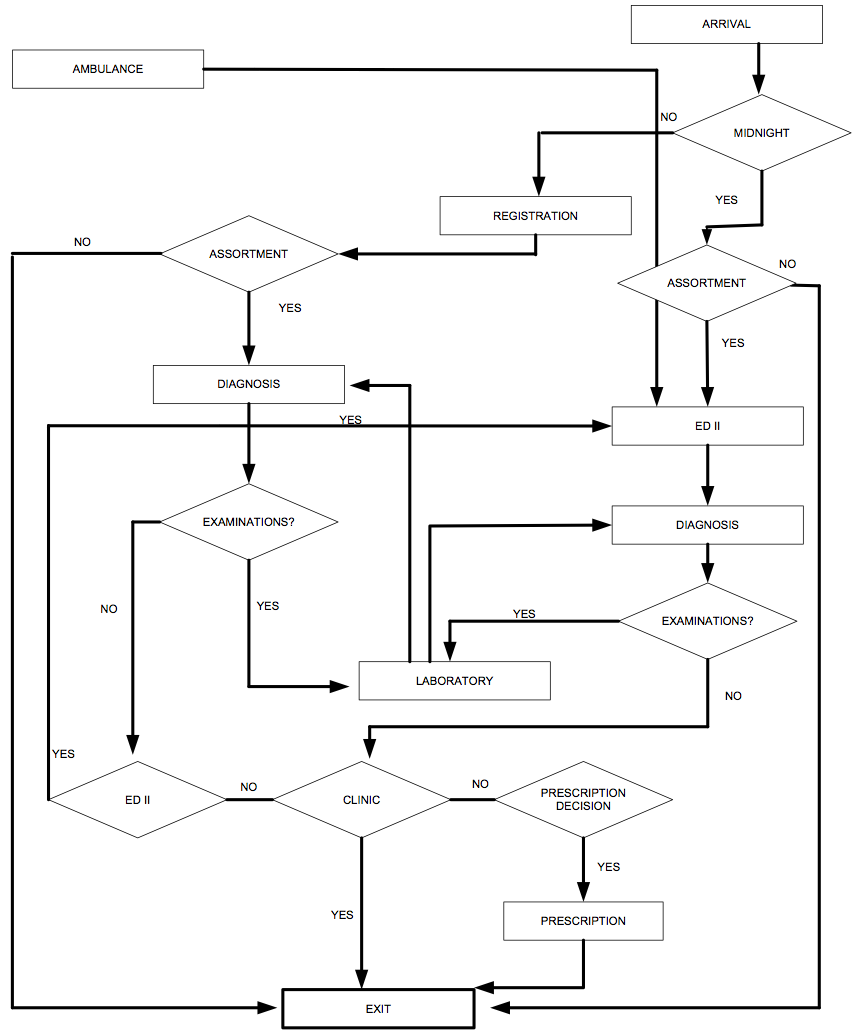
Figure 1: Emergency department process model (assumed process)
One of the goals was to use the flow chart to perform simulations of the process. Furthermore, we received a sample of data covering 250 patients who visited the emergency department from the hospital information system to compare the actual process with the expected process using process mining techniques.
Process mining results
As a first step, the actual process was discovered using process mining (see pictures of the simplified process below).
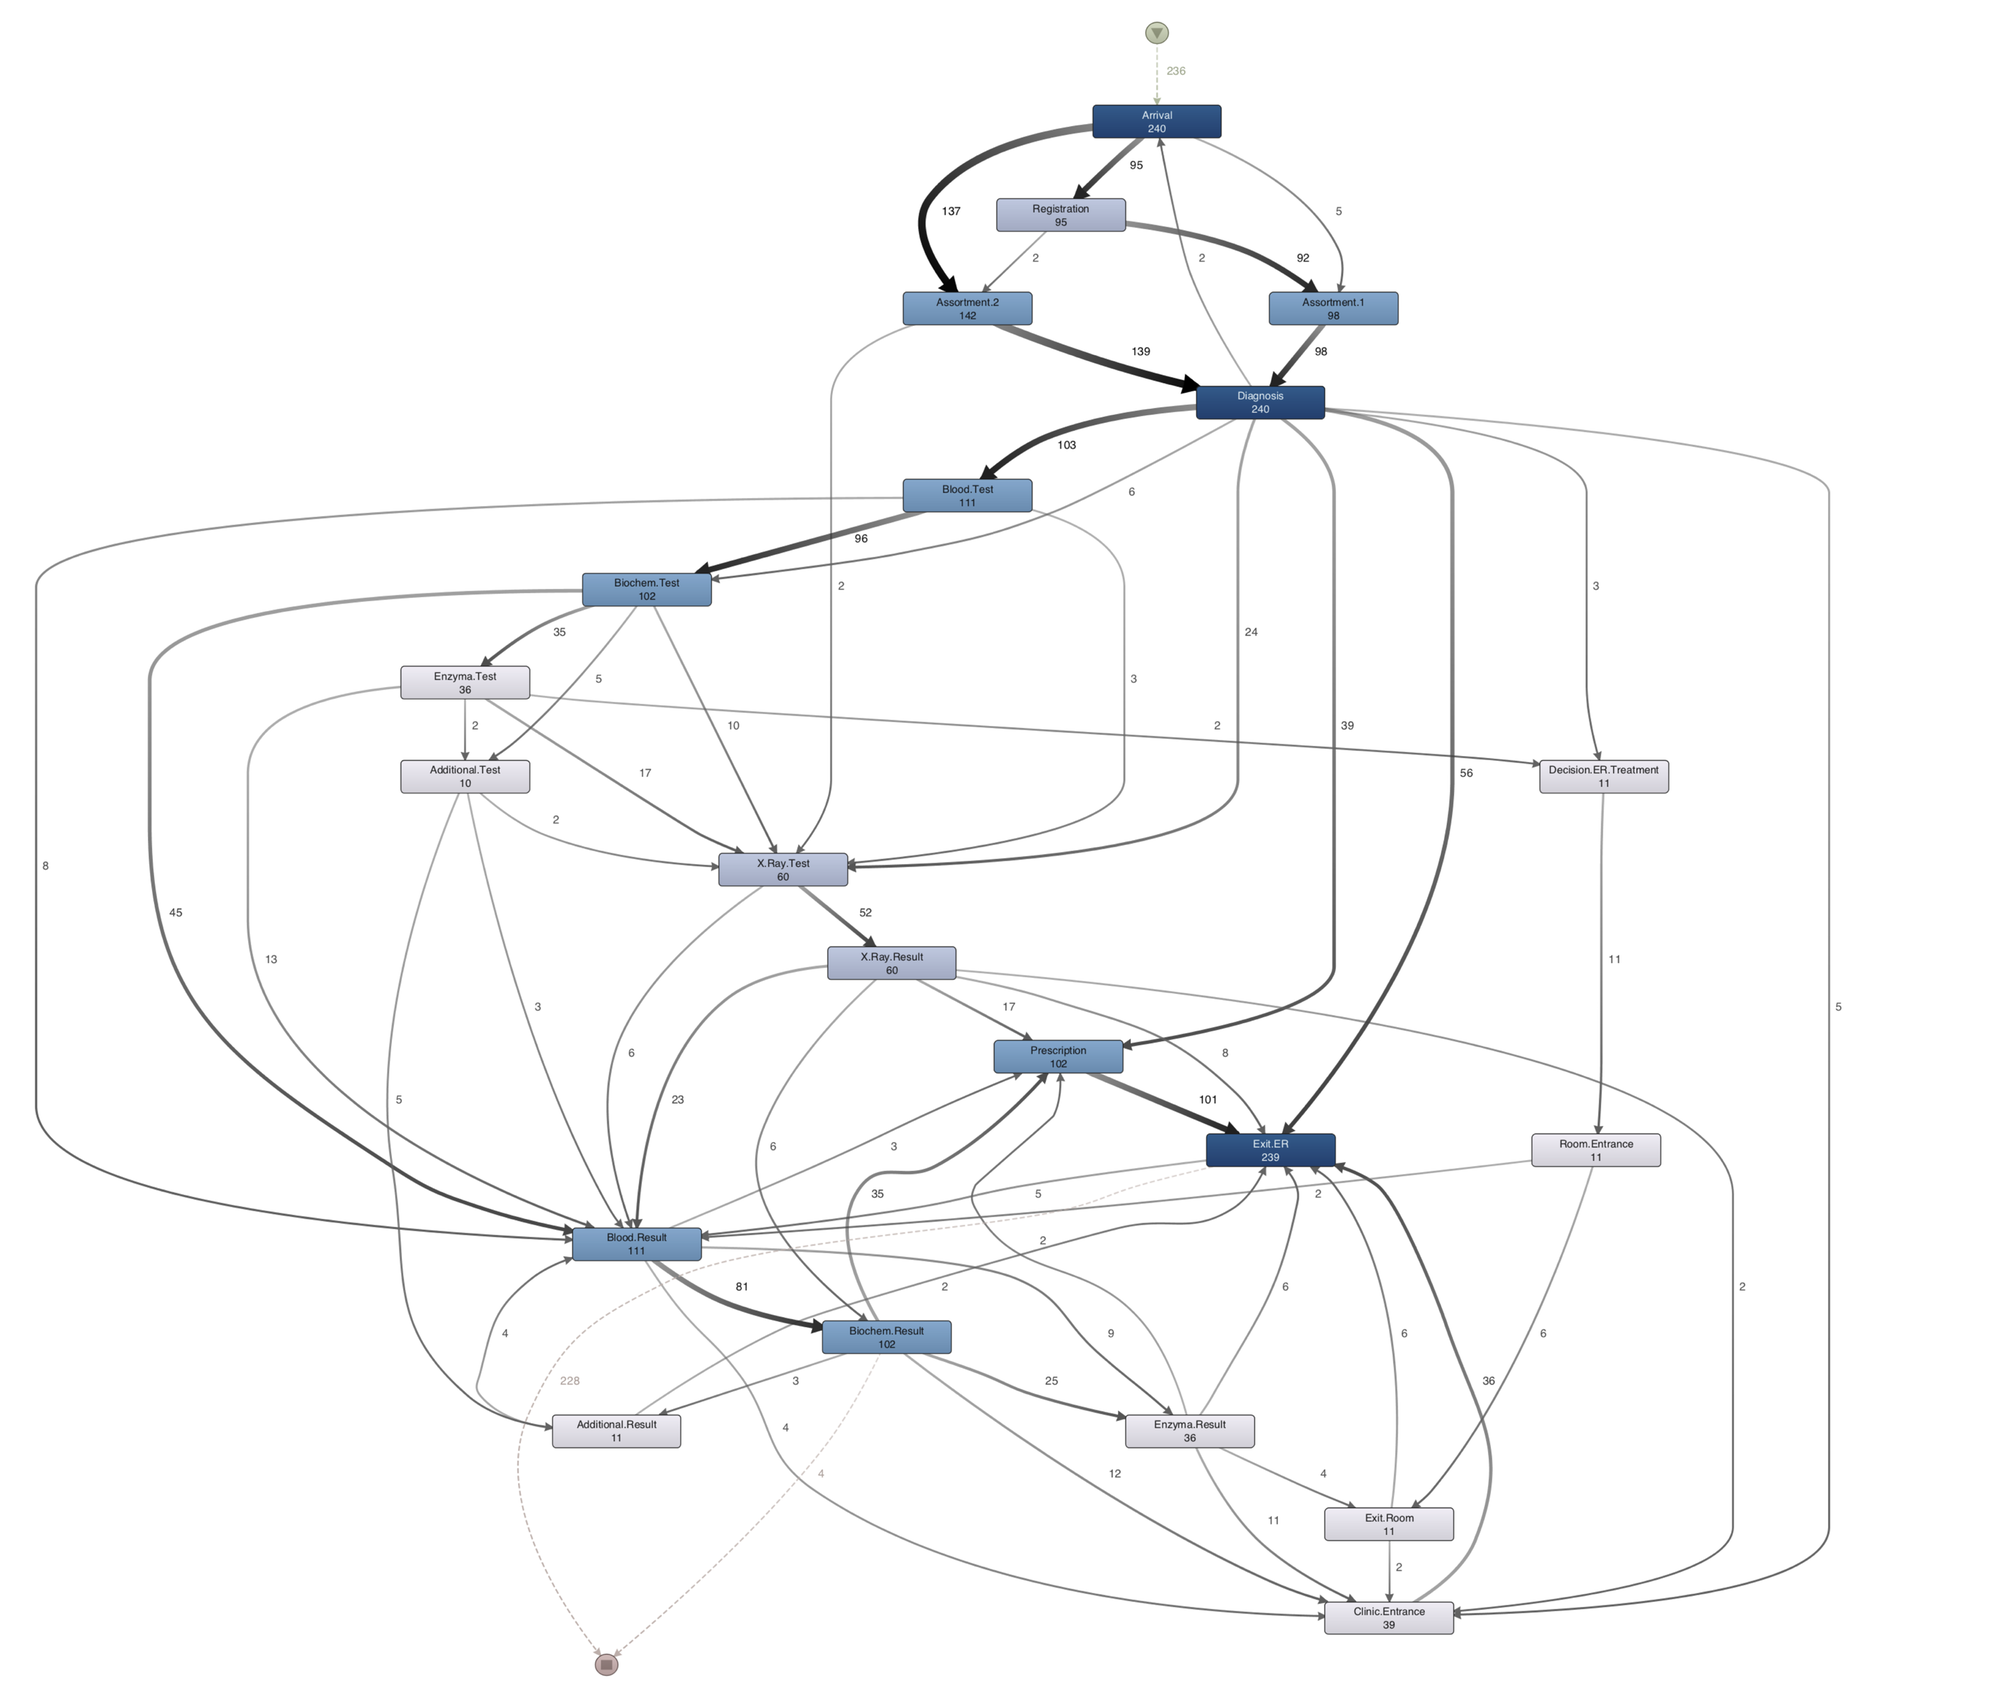
Figure 2: The discovered process (100% activities, 0% paths detail – only most important flows are shown)

Figure 3: The discovered process (100% activities, 50% paths)
Several differences could be found by comparing the real process on different levels of detail with the assumed process from Figure 1:
-
There are more entry points as well as exit points to the process than the ones illustrated by the flow chart. The team used the First in case / Last in case features of Disco to find them. For instance, for few cases ‘Diagnosis’ or ‘Blood Test’ was the initial activity. For other cases, the last activity was ‘Assortment’ or ‘Blood Result’ (or other lab results). While the additional start activities are not so important, the additional exit points require administrative actions.
-
There were cases, where patients exit right after Diagnosis – a path which did not exist in the flow chart. Of course, a doctor can diagnose that the sickness is not severe, but letting patients leave without any examinations or lab tests is still an action that could be challenged.
-
People may take some lab tests (especially biochemical and enzyme test which take considerable time), leave the hospital and return later. This path is not illustrated in the flow chart.
-
There were several cases where prescriptions were made without any examinations. Again, this is possible according to medical guidelines, but it could be investigated.
The focus of the analysis was not check for conformance2 but to understand the actual process. Recall that the process in Figure 1 is not a rigid prescription of the process but a description of the process by a domain expert.
What became apparent, however, was that the assumed process was not suitable as a basis for simulation, because – due to a lack of alignment with the real process – it would produce faulty results.
As seen in previous healthcare case studies, the actual process exhibits a lot of variation, which can be expected due to the individualistic nature of each patient’s treatment. You can see this variation in the discovered process maps in Figure 2 and Figure 3. Figure 2 is already quite complicated, although it only shows the most important paths in the process. Figure 2 shows 50% of the paths (still not 100%) and the process already looks like spaghetti.
Due to their complexity, these spaghetti diagrams were of little usefulness for the management committee. So, the challenge was to create simpler process maps that could be used to derive insights about the process.
A common technique for more structured processes is to concentrate on the most frequent variants in the process. However, due to the high variation in the process, the most frequent variants would cover only a small percentage of the patients: Out of 84 observed process variants 68 were followed by just one or two patients (see highlighted area in chart below).
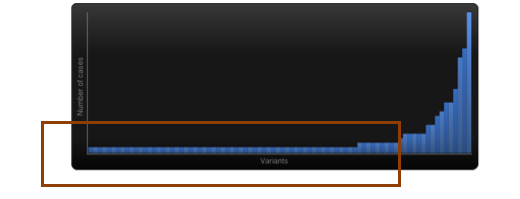
Figure 4: 68 out of the 84 variants were followed by just one or two patients
Therefore, the idea was to provide the management team with scenarios based on behavioral clusters of the process. We calculated a similarity measure for traces, applied a simple technique to deal with outliers, and used spectral clustering to get the clusters.
Clustering allowed us to summarize the 84 variants into three, more intuitively explained, process models (see figure below).
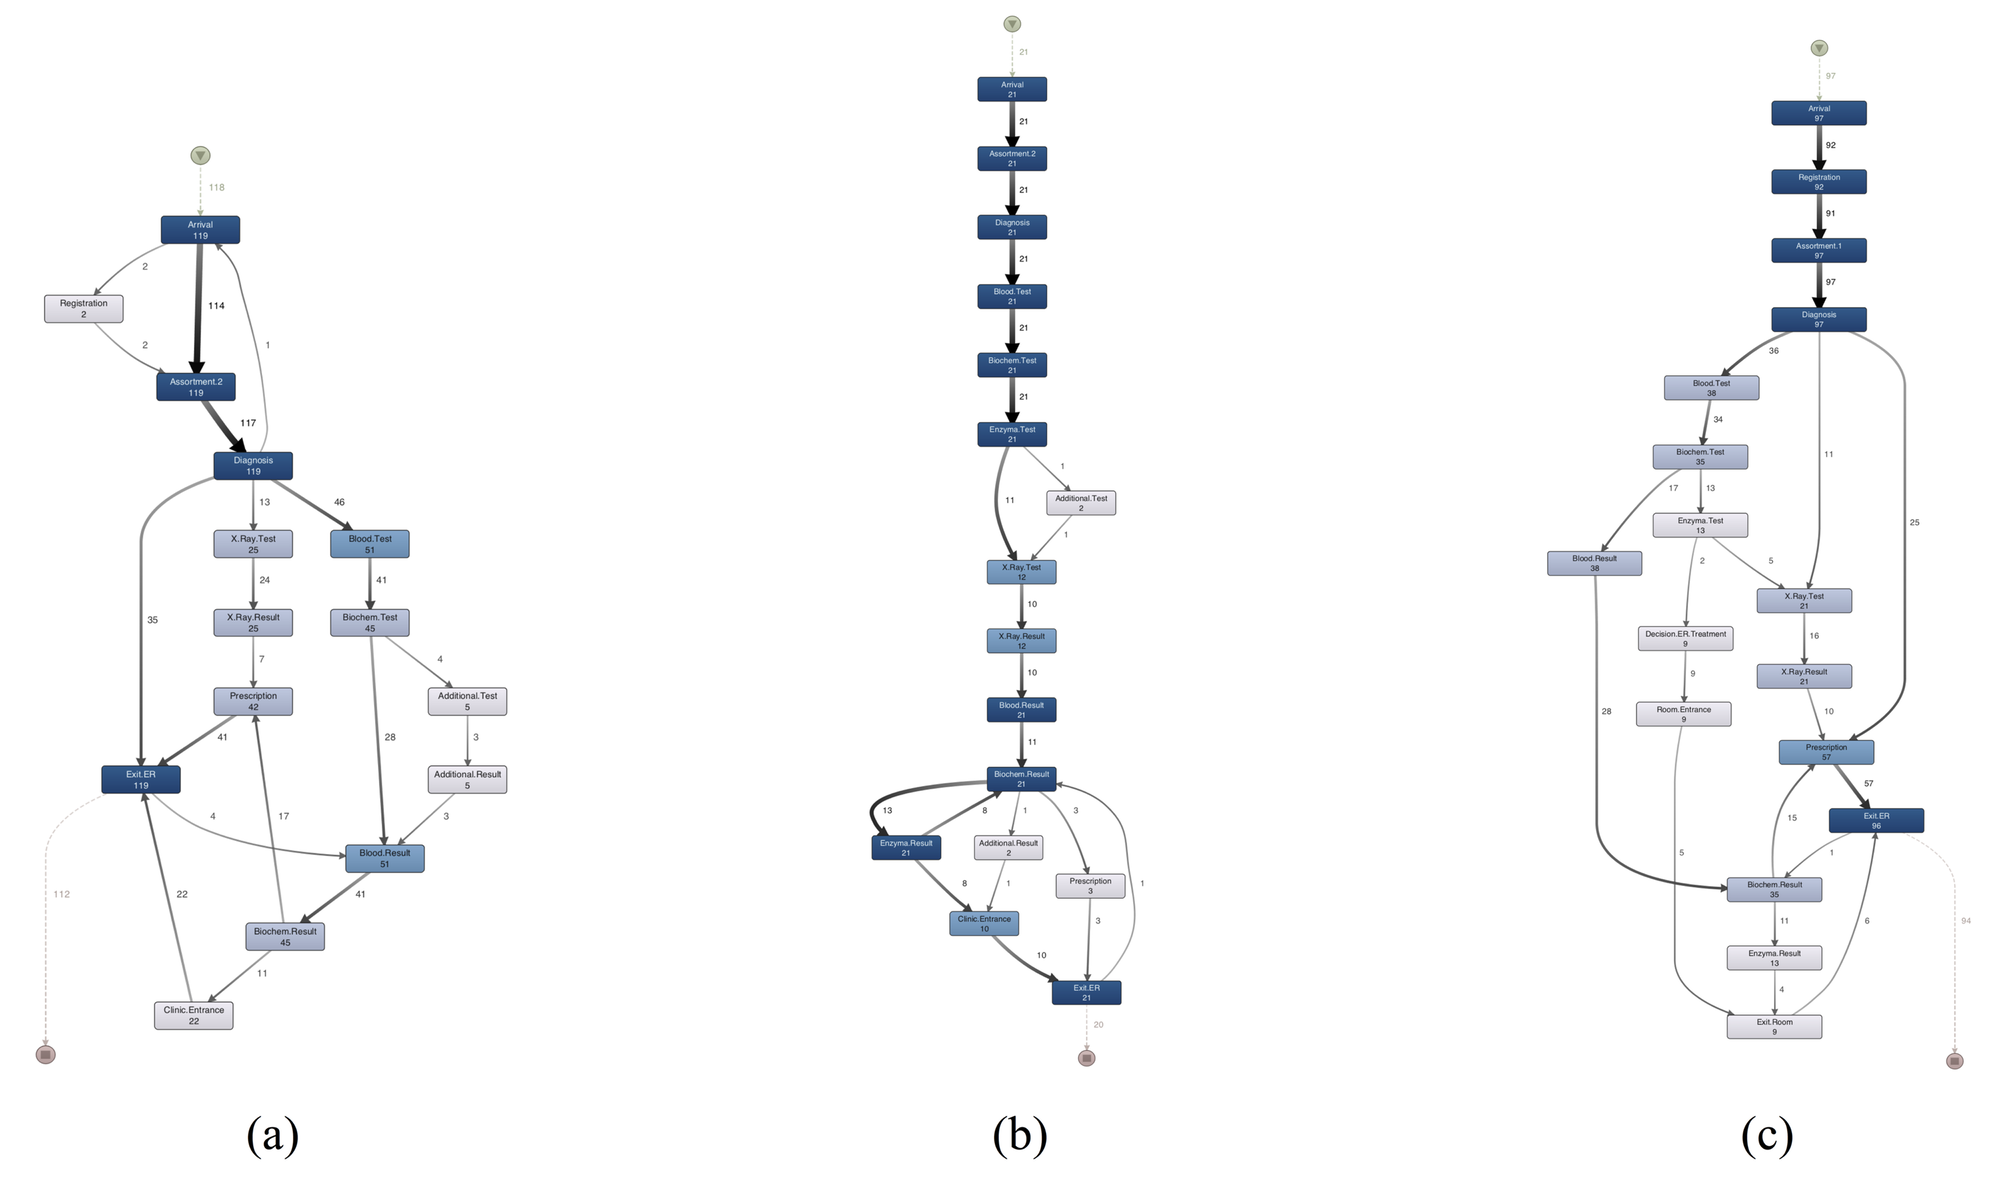
Figure 5: Process models for each of the three clusters (100% activities, 0% paths detail only most important flows are shown)
When comparing the process flows for these three clusters, the following difference can be detected:
- In Cluster (a), the ‘Registration’ step is often skipped. The overall distribution of the triage percentages in the sample was: Green ~34%, Yellow ~57%, and Red ~8%. Cluster (a) has exactly this distribution. However, Green cases (not severe) of this cluster visit the hospital during the night shift. It was surprising that so many patients with Green triage visited the emergency department during the night.
This can be attributed to the economic crisis: Before the crisis, the emergency department in public hospitals in Greece was free. After the crisis, the registration costs 5 Euro. However, during the night, there is no registration at that particular hospital because there is no secretary available. So, poor people with not severe health problems wait until the night to visit the hospital, in order to avoid paying the 5 Euros.
-
In Cluster (b), ‘Registration’ is also skipped, but this can be attributed to a higher emergency of cases (much more Red cases than normal). Moreover, this cluster has a higher frequency of lab tests (all patients have blood / biochemical / enzyma tests). Finally, this cluster has a high percentage of patients that enter a clinic rather than just leaving the hospital.
-
Cluster (c) is closest to the expected flow (but Yellow cases are over-represented). People get registered, assorted, have some tests, and are forwarded towards the exit via the expected way (after a prescription or a treatment in the ED room).
Impact
Why is this important?
In retrospect, we were able to correlate the patients’ clusters with their triage. Since it is quite easy to estimate the statistical distribution for the triage, exploiting the process model of each cluster, it is possible to predict more accurately the workload per activity, create a better resource allocation plan, etc.
Furthermore, based on the results, we were able to communicate the parameters of operations management to doctors, who usually claim that medical guidelines cannot allow for operational optimization.
Finally, we could provide interesting insights, such as that some patients with not severe illnesses came to the hospital at night to avoid the registration costs of 5 Euro, which can be attributed to the economic crisis.
-
The paper Clustering Healthcare Processes with a Robust Approach, authored by Pavlos Delias, Michael Doumpos, Panagiotis Manolitzas, Evangelos Grigoroudis, and Nikolaos Matsatsinis, was presented at the XXVI EURO – INFORMS Joint International Conference. ↩︎
-
There were no medical guidelines provided to the team for an actual conformance analysis. ↩︎
Leave a Comment
You must be logged in to post a comment.