MuleSoft Anypoint Visualizer
Blog: BPM Blog Avio Consulting


At the end of June, MuleSoft released an Anypoint Platform tool that I am so excited about, called the Anypoint Visualizer. As the name implies, the Visualizer provides visibility into your application network, giving you additional insight into your APIs, including:
- Which layer an API resides within (i.e. experience, process, system)?
- Who is using the API?
- What are the dependencies of an API (other APIs, databases, backend systems, etc.)?
As you build out your application network, the above details become really important, providing a better understanding of your runtime, as-built architecture. This is needed, for example, to understand dependency requirements during impact analysis; to enforce governance of layers – ensuring APIs are used correctly, or to use as a runtime dependency tool for troubleshooting purposes.
Typically, on a project, I would keep track of these details in various sites including Confluence and Exchange
- Listing of the APIs a process API invokes
- Documenting which databases a system API invokes
- Which API a proxy API is associated with
While helpful, it was still only consisted of static data, which is why I was ecstatic to see this type of tool now available within Anypoint Platform. With the Visualizer, the gap is now filled, documenting these inter-dependencies in real time.
Features of Anypoint Visualizer
To enable an API to be displayed within the tool, there are a just few pre-requisites (see Caveats section for details). The good news is that there are no updates required to code, just simply deploy the API. After it is deployed it will show up within the Visualizer, allowing you to categorize it into the API level:
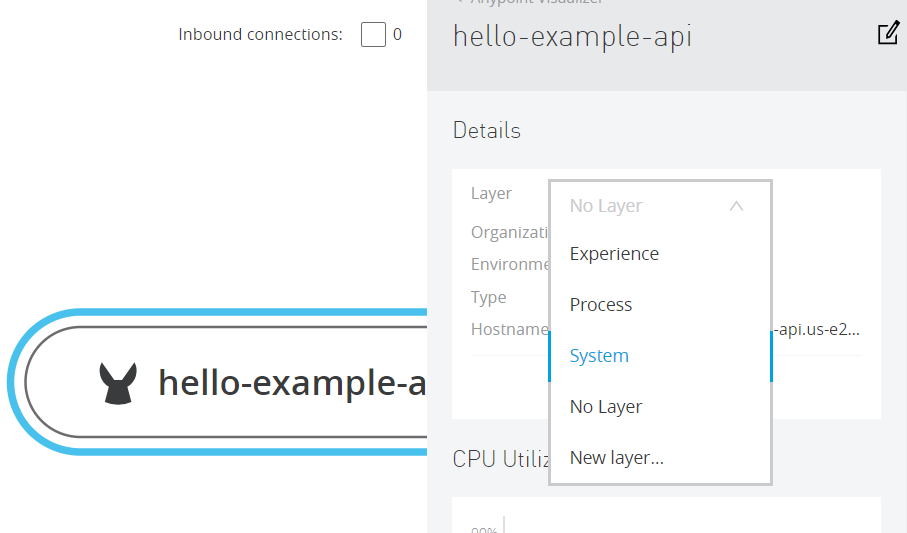
To understand the inter-dependencies, invoke the API. Connectivity lines will then be drawn between the inbound application, APIs, and backend systems, etc.
Layers
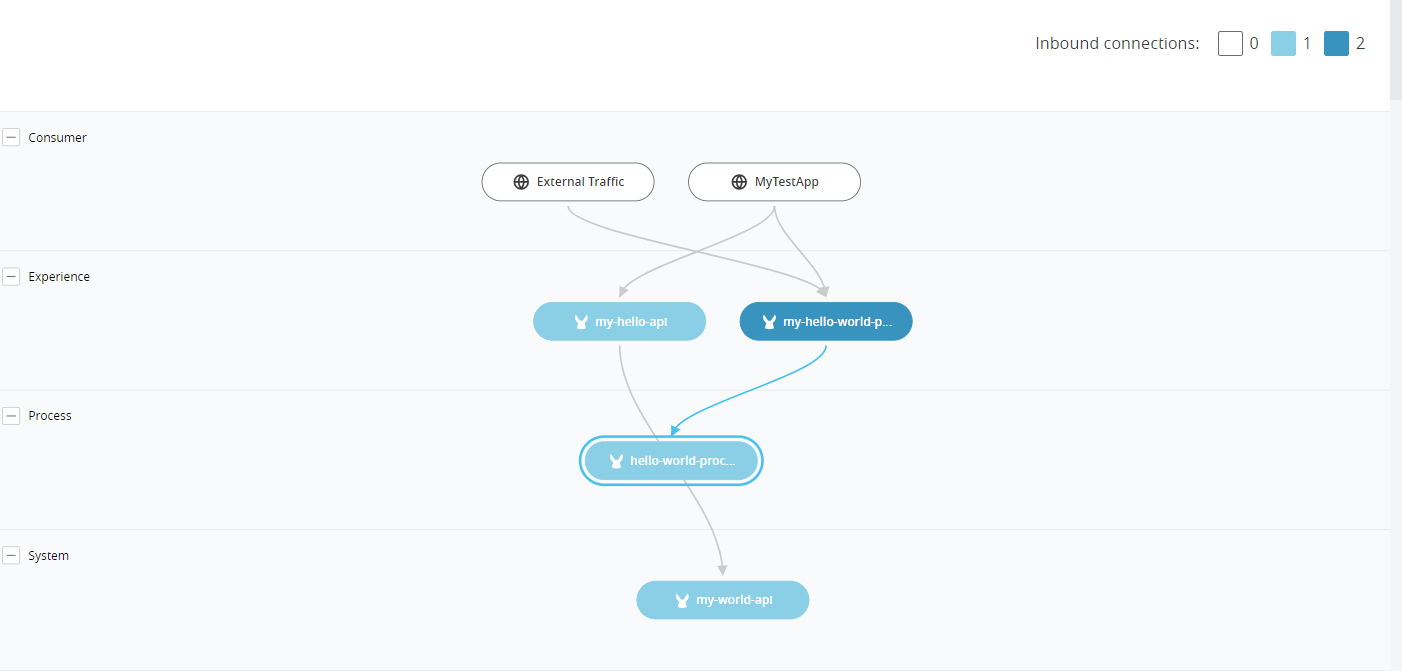
Experience, Process, and System layers are provided OOB, but the outer layer names can be customized to denote, for example, the consumer layer or back-end system layer:
Application Identification
Understanding who is using your API can be facilitated by applying the Client Id Enforcement within the API Manager. Within the Anypoint Visualizer, this attached policy will provide a visual depiction of the API consumers. In the above screenshot, you probably noticed the consumer layer has a couple of inbound connections: External Traffic and MyTestApp. External Traffic is the default name for APIs not protected by Client Id Enforcement. But for those that do have this enforcement, the Visualizer will denote the client id of the requesting application (renamed to MyTestApp in above screenshot). This allows you to understand who is using the API, along with how they are using it.
Metrics
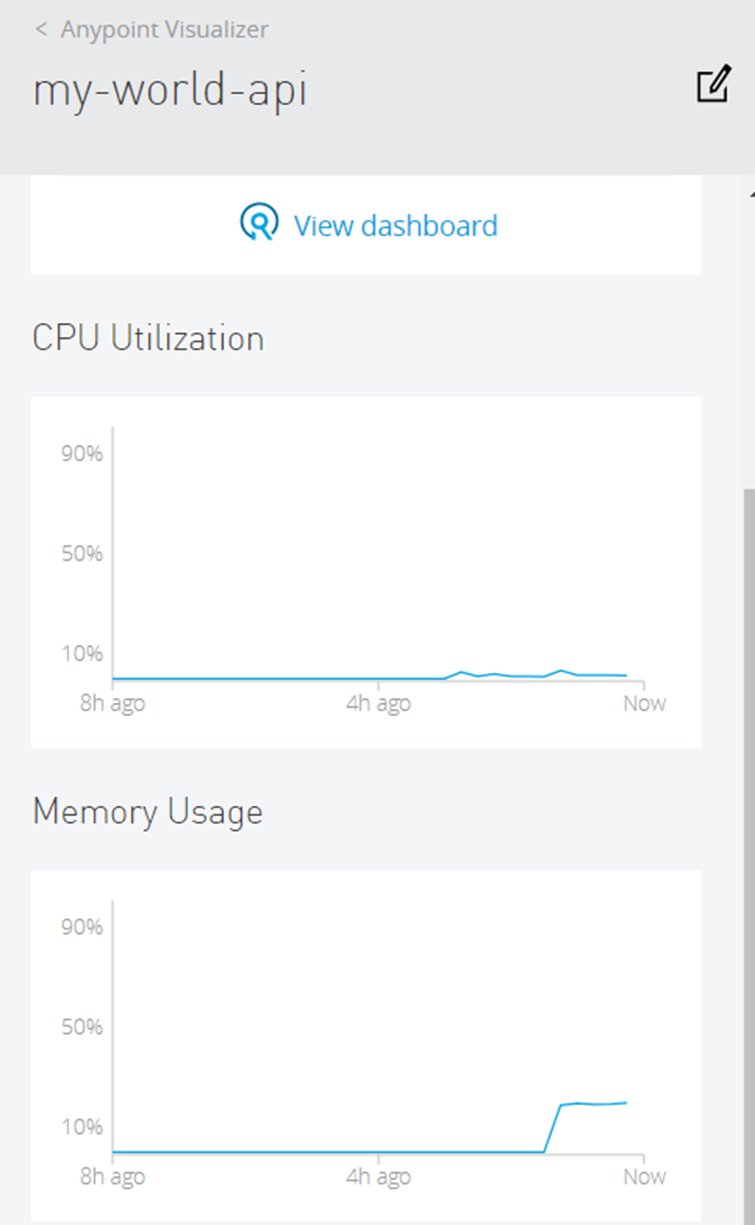
CPU utilization along with memory usage is also available in the Anypoint Visualizer screen, along with a click into the link to the dashboard for a given API:
Caveats
As with most first releases, there are caveats that need to be considered:
Only keeps history for 7 days
- Works with Mule Runtime version 3.9.1 and 4.1.3 (need to redeploy with new runtime)
- Only works for APIs deployed to CloudHub, not Mule on-premise
Check out this new tool in Anypoint Platform!
Leave a Comment
You must be logged in to post a comment.





Join the Conversation