
Measuring RPA: 10 Performance Metrics for Assessing Robotic Process Automation Benefits
Blog: Cigen
Robotic process automation is growing more and more popular, and you’ve most likely already heard about its benefits: improved accuracy via elimination of manual errors, creation of quasi error free databases, more satisfied employees, streamlined workflows, etc.
However, merely listing these gains is not very likely to convince your stakeholders that RPA is indeed a competitive advantage for your company. RPA performance metrics are necessary to make a convincing case for automating business processes because it provides a crystal clear quantitative demonstration of its financial, business and operational impact on the company.
Measuring RPA in a restricted sense amounts to measuring the financial return on investment (ROI) of RPA in your company. By tracking the RPA ROI, performance metrics also allows more realistic planning of the future of your automation journey towards enterprise wide use. However, there are also metrics to assess qualitative benefits, e.g., employees’ job satisfaction.
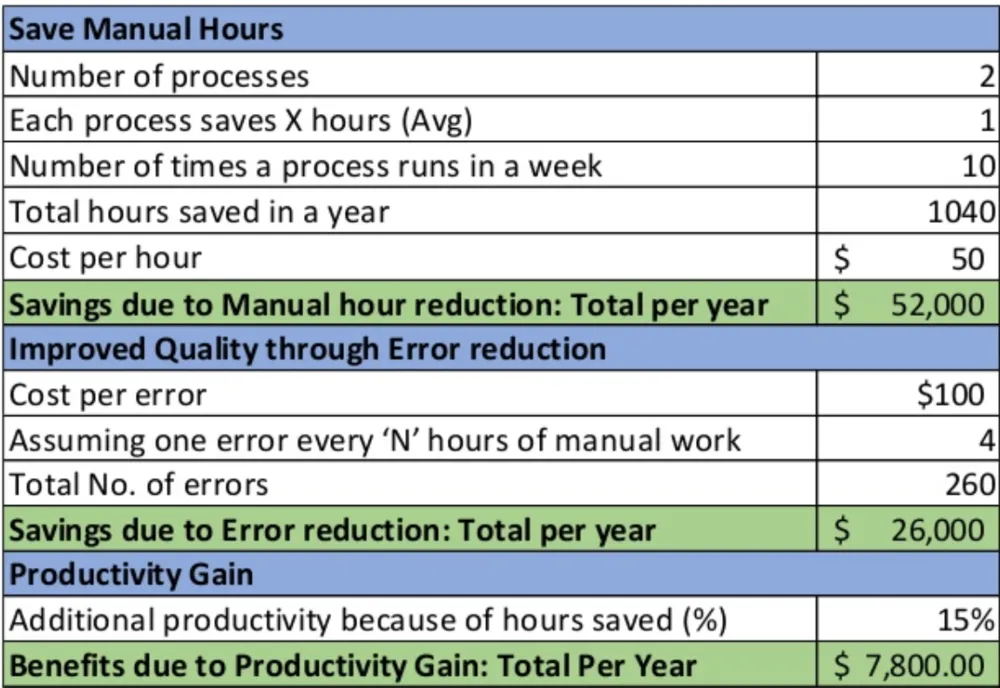
Example of tracking RPA ROI https://www.slideshare.net/ARJUNMEDA1/how-to-design-rpa-performance-metrics
The idea behind robotic process automation performance metrics is to compare “before” and “after” for automated processes. Generally speaking, “before” refers to a way to measure the manual effort multiplied by the work cost (i.e., the salary of the employees performing the tasks), while “after” is the sum between the cost of the RPA tool and that of the people who handle RPA maintenance. Of course, you aim to show that automation results in cost reduction, where ‘cost’ covers both financial and human-centred costs.
How to measure RPA performance metrics and RPA ROI
In what follows we will provide short descriptions of some performance metrics that can help you evaluate objectively the consequences of RPA deployment in your organisation. More, those outcomes can be used as arguments to persuade decision makers that RPA is precisely what your company needs.
1. Improved accuracy.
Automation allows you to eliminate the errors that are unavoidable in the case of manual performance, due to boredom, fatigue, lack of concentration, etc. The proof for this claim comes from comparing the amount of work that needs to be done to compensate for errors before and after RPA implementation. The interpretative principle is that lesser need to redo the work due to errors means more efficient processing, in less time and for less money.
2. Need for intermissions.
Another feature that leads to robots’ increased productivity is their capacity for quasi continuous work, with infrequent upgrade interruptions. Hence, measuring RPA can be done by comparison of how much downtime human employees’ need to complete processes, with robots’ downtime.
3. Audit trails digitisation.
By passing on to robots the dull audit tasks, such as carefully scanning previous records, internal control testing, detail testing, reconciliations, etc., employees can handle more proficiently the complex activities. Investigating abnormalities, or estimating fair-value investments are some of them. You can assess progress by contrasting the proportion of digitised audit trails with those that are still manual. Assessment should be done per individual process, and per specific timeframes.
4. Evaluation of compliance deficiencies due to data entry errors.
Compliance issues are one of the major negative consequences of making errors when handling data. Measuring RPA amounts to an appraisal of the compliance deficiencies in terms of number of errors and the cost of fixing those errors. The evaluation should be done for a certain period of time before you implement RPA, and compared with the numbers you get for a similar period after launching. You can expect the latter to tend to zero.
5. Engagement in new projects.
When software robots take over repetitive tasks and complete them much faster, humans can be reallocated to new projects that tap into their more complex abilities, such as communication, creativity, critical thinking, problem solving, etc. Pick a certain time prior to automation and tally the number and quality of new projects developed by employees. For the qualitative assessment, you need to consider the design, planning, as well as the new tasks assigned to the employees. Do the same for a similar period subsequent to automation and compare the results.
Thank you!6. Workforce impact.
This can be tracked by several metrics that take into account manual labour savings (in terms of the number of labour hours saved per year), the reduction in case workload per tax, and the number of employees reallocated. Full-time equivalents (FTEs) are the typical way to operationalise labour savings, but you can also look at the costs involved by hiring, training, and salary. We recommend assessment in periods of high demand (e.g., end of the month), because this is when the costs are highest. The scalability of software bots can be a valuable asset to be used in such times in order to reduce expenses. It makes it likely that the marginal cost of scaling the robotic workforce during peak periods is less than the average cost of handling everything manually.
7. Tool utilization.
Prior to RPA deployment, take stock of the number and kind (i.e., either automations or manual ones) of tools that are needed to carry out a certain process, so that you can then estimate the costs. For an accurate measure, make sure you also include licensing fees, maintenance and development costs, as well as the cost of training employees to use them. Compare this with a similar approximation of the RPA tool costs. The latter are going to be lower because the bots do not need to be operated from individual machines, but rather in a centralised manner.
8. Cycle time.
This is a measure of process velocity, or the amount of time necessary to complete a process. Since bots never tire and never need to take a break to ruminate on the meaning of life, RPA results in significantly lower cycle times. You can see this for yourself by comparing the amount of time it takes human employees to execute a given process with the time it takes a bot. Since cycle time depends on the total volume of work, which is variable, we recommend that you anchor the two estimations to periods which are similar in this respect.
9. Employee retention rate.
Employee turnover is rather costly; according to a Center for American Progress study the median cost is over a fifth of the annual employee salary. RPA can support retention by taking over the highly repetitive tasks which are among those with the highest turnover. Employees are thus relieved from the burden of monotonous, uninteresting tasks, and free to focus on higher value tasks which are also business-critical and thus leave the staff more fulfilled, satisfied, and less likely to leave the company. Contrasting retention rate before and after RPA implementation is a relevant indicator of automation driven gains. However, it is a longer term metric because employees’ reaction takes time to form and manifest itself behaviourally.
10. Employee satisfaction.
This is a qualitative measure of employee engagement on the short term. All you need to do to use it as an indicator of RPA profitability is to ask your employees to fill in surveys regarding satisfaction with their roles and workloads before and after automation. You should initiate surveys in those department mostly affected by automation. The expectation is that the less manual repetitive tasks employees must perform, the more their job satisfaction will increase and the more engaged they will be. A necessary precondition is that the staff is well trained into what automation can and what it cannot do. This so that they do not fall prey to the ‘robots will steal our jobs’ attitude, which would make them rather hostile to software robots. This is why gaining the confidence of people in your organisation is a top practice for a successful automation journey, which facilitates scaling up.
Conclusion
The bottom line is that RPA performance metrics help you evaluate the progress towards the goals that you are set on when deciding to embark on the automation journey. Availability of such a wide range of metrics serves to make an even more convincing case for the utility of RPA deployment. They can provide an exhaustive analysis from the perspective of selected criteria that you consider most relevant for attaining your goals.