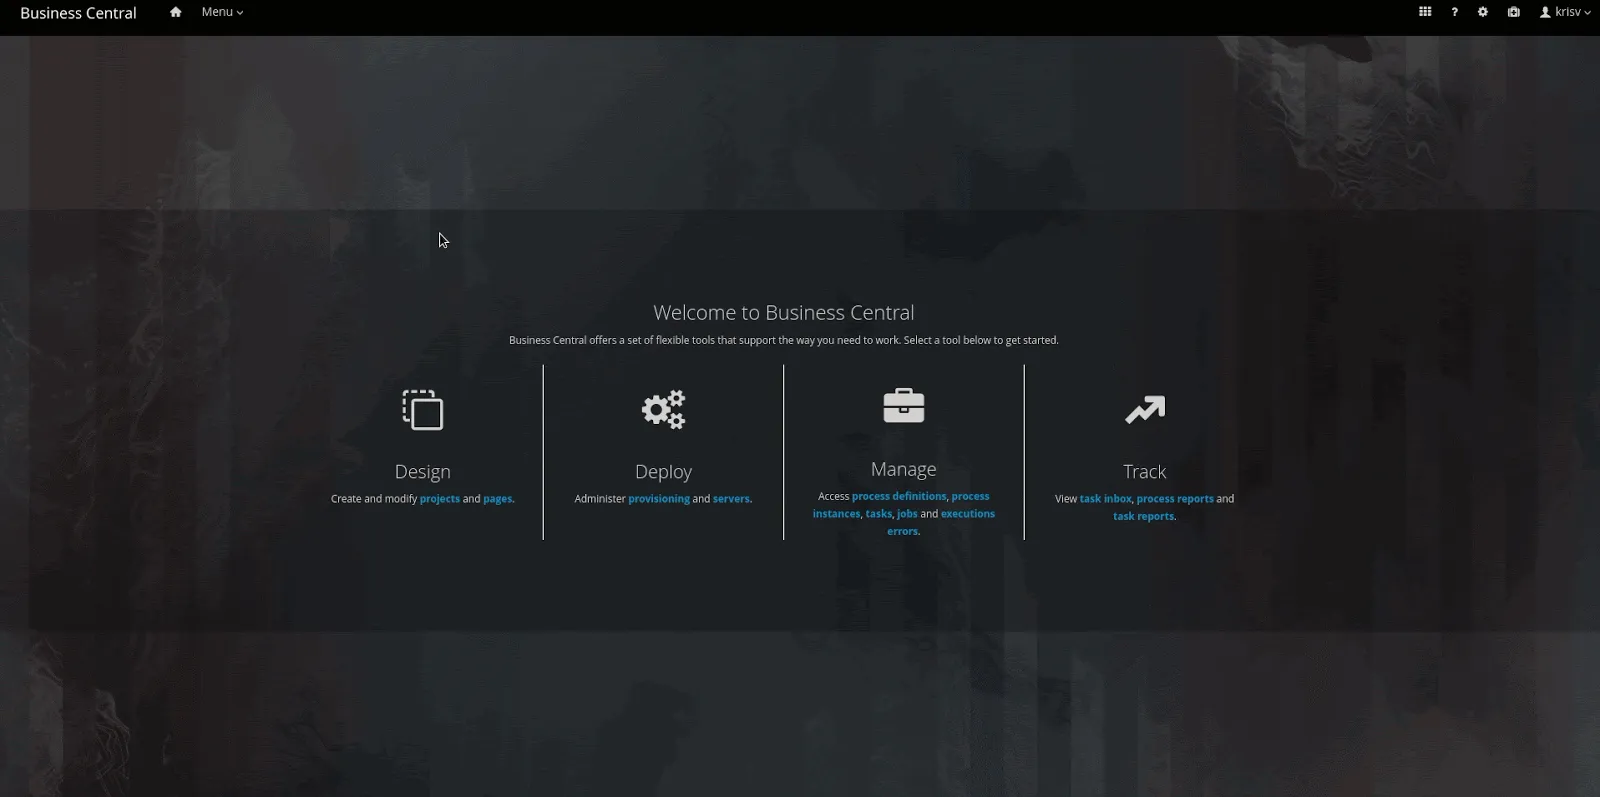
Kafka is one of the major platforms for async communication in cloud computing and jBPM has a nice integration with it, making it part of a business process.
In real-world projects, monitoring the Kafka queues used by jBPM can help you to identify process bottlenecks.
Previously we talked about Prometheus data sets in Business Central via DashBuilder, and today we will show how to monitor Kafka queues from jBPM using a Kafka Data Set which is included by Business Central 7.52.0 and onwards.
Kafka Data Sets
The first step to build a dashboard is having data sets. To retrieve information from Kafka, Business Central needs to invoke Kafka “mbeans” and all the metrics are identified after the MBeans names. (for more information, check the AMQ guide about how to monitor Kafka installations)
Having this said, bear in mind that the metrics are a snapshot of the Kafka status, because it does not accumulate value. For this purpose, users must set up an agent in Kafka and store the metrics in a system like Prometheus for cumulative and historical values.
Business Central supports 3 types of Kafka data sets:
BROKER: When using Broker you will be monitoring Kafka server metrics, general metrics;
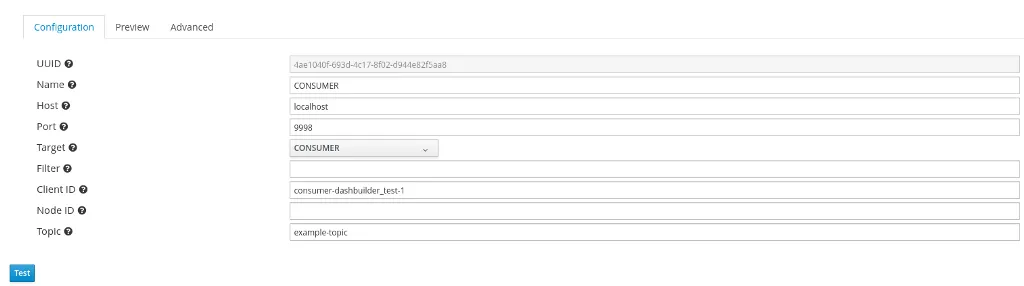
CONSUMER: To monitor consumers and messages handled by a consumer;
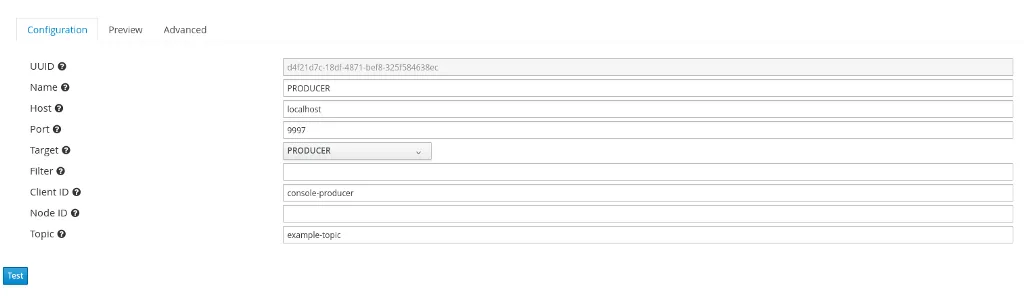
PRODUCER: To monitor producers and messages created by a producer.
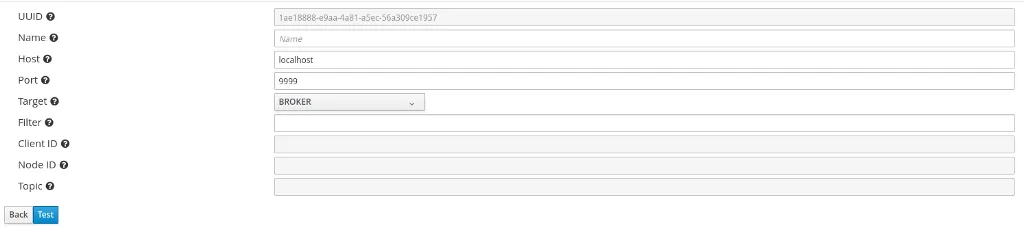
The common parameters for all types are:
Name: Give the data set a name;
Host: The host where Kafka component (BROKER,CONSUMER or PRODUCER) is running;
Port: The JMX port. When making Kafka available for monitoring you must set a JMX port;
Target: Select the target installation type: BROKER, CONSUMER, PRODUCER;
Filter: Any text used to filter the result, this way we can create data sets focused on a specific set of results. It is a “LIKE” operation, which means that it only shows results that contain the text in the filter
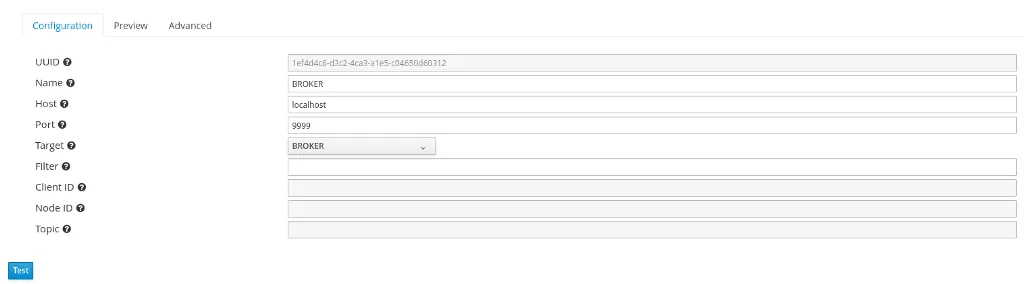
The properties above are all you need to create BROKER metrics. When you select CONSUMER or PRODUCER then there are other possible parameters:
ClientID: This is a mandatory field for CONSUMER and PRODUCER, it identifies the client ID;
NodeID: The node id is an optional parameter to identify a node from which we want metrics from;
TopicID: The topic id is an optional parameter used to identify a topic from which we want metrics from.
To create a Kafka Data Set, log in Business Central, go to Admin -> Data Sets, click on “New Data Set” and select Kafka from the list:
Now, you can fill the required fields and test the data set. After a successful test, you can go back to the setup screen to add a filter if necessary.
Kafka Monitoring Dashboard
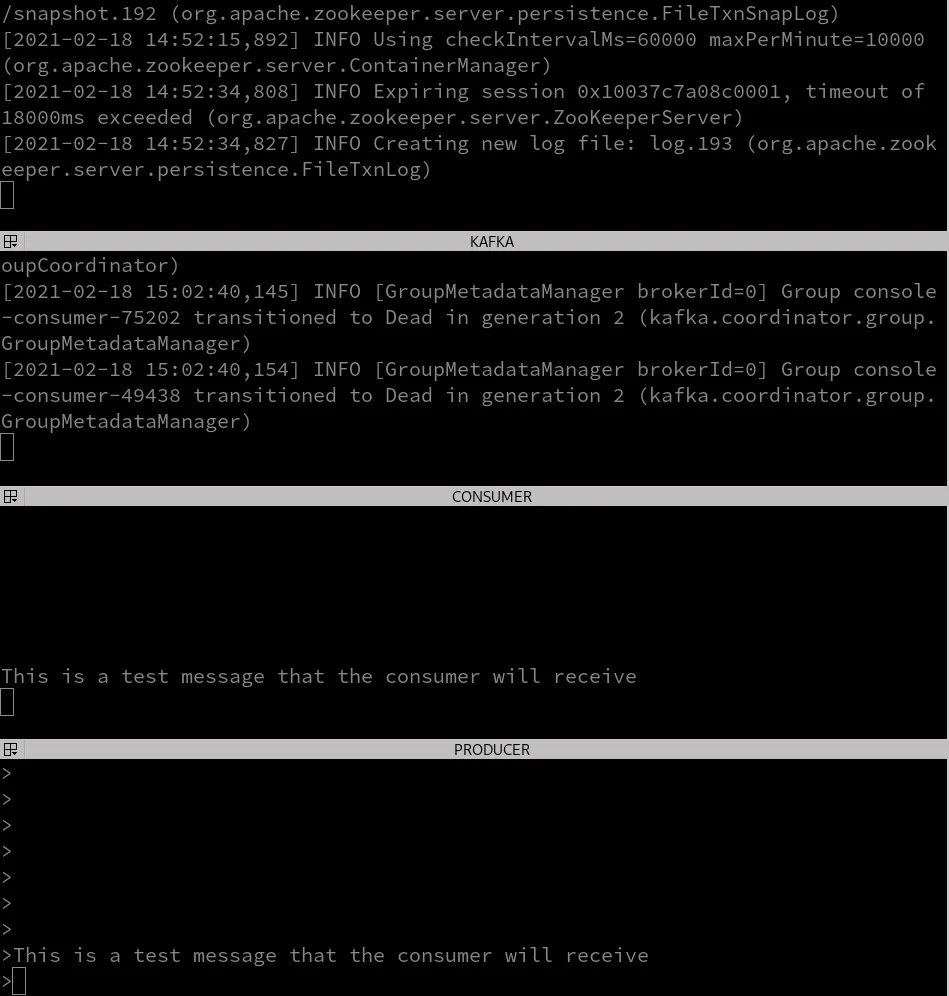
Now that we know about Kafka data sets let’s create a simple Dashboard. First, make sure you downloaded Kafka locally. Using Docker is possible but you must make sure that JMX ports are exposed.
In a new console start Kafka (Broker) — before export JMX_PORT=9999
export JMX_PORT=9999./bin/kafka-server-start.sh config/server.properties
Create the topic using some console window
./bin/kafka-topics.sh — create — topic example-topic — bootstrap-server localhost:9092 — replication-factor 1 — partitions 1
In a new console start a Consumer — export JMX_PORT=9998
export JMX_PORT=9998./bin/kafka-console-consumer.sh — group dashbuilder_test — topic example-topic — bootstrap-server localhost:9092
In a new console start the Producer
export JMX_PORT=9997./bin/kafka-console-producer.sh — topic example-topic — broker-list localhost:9092
In the producer window, you can type the text that will be received by the consumer.We are done on the Kafka side, now let’s create the required data sets in Business Central. Let’s create three of them, one for each type using the following parameters.
Host: localhostPort: 9999 for broker — 9998 for consumer and 9997 for producerClient ID: console-producer for producer or consumer-dashbuilder_test-1 for consumerTopic: example-topic
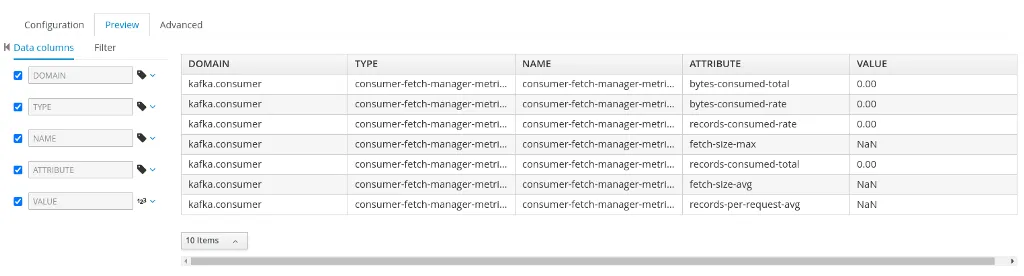
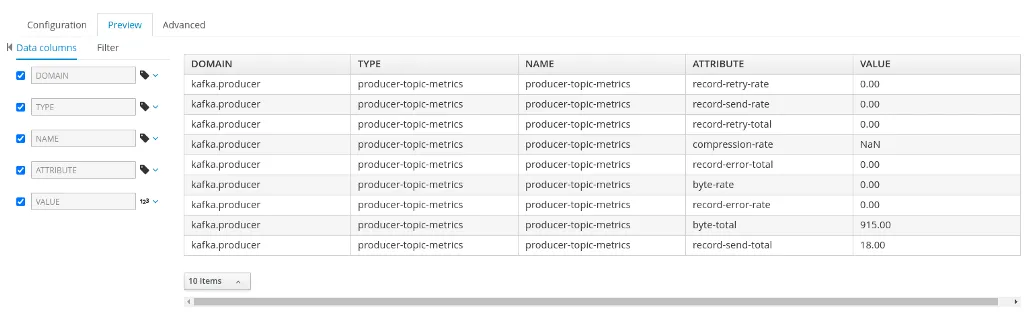
BROKER:BROKER OUTPUT:CONSUMER:CONSUMER OUTPUTPRODUCER:PRODUCER OUTPUT:With these 3 data sets, we can now monitor the topic “example-topic” and query everything about the broker. In Business Central you can now create dashboards using the data sets we created:
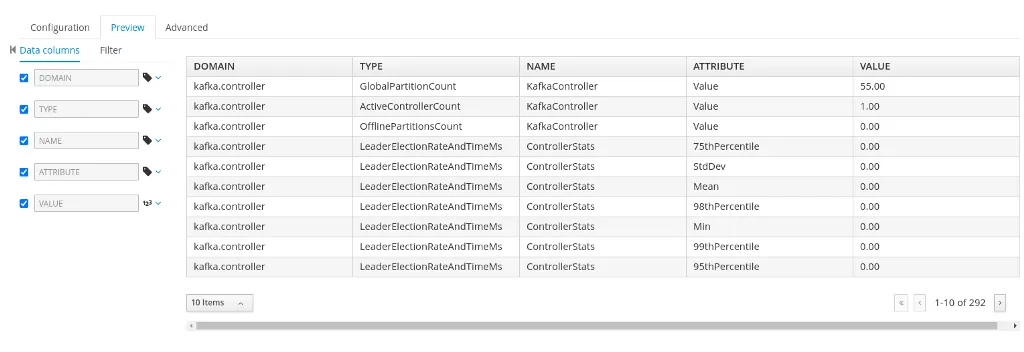
Go to Design -> Pages and create a new Page
Drag the Table Reporting component to the page and select any of the Kafka data sets
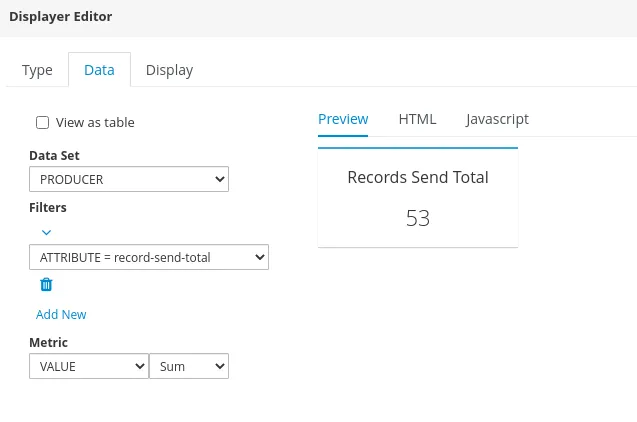
Since each metric is a data set row, to show a specific attribute we can also filter the data set when building the data set, here’s an example to show specifically the number of records for the producer:Users can decide to create specific data sets for the wanted attributes using the filter field or create a data set with all attributes and filters when creating the dashboard.
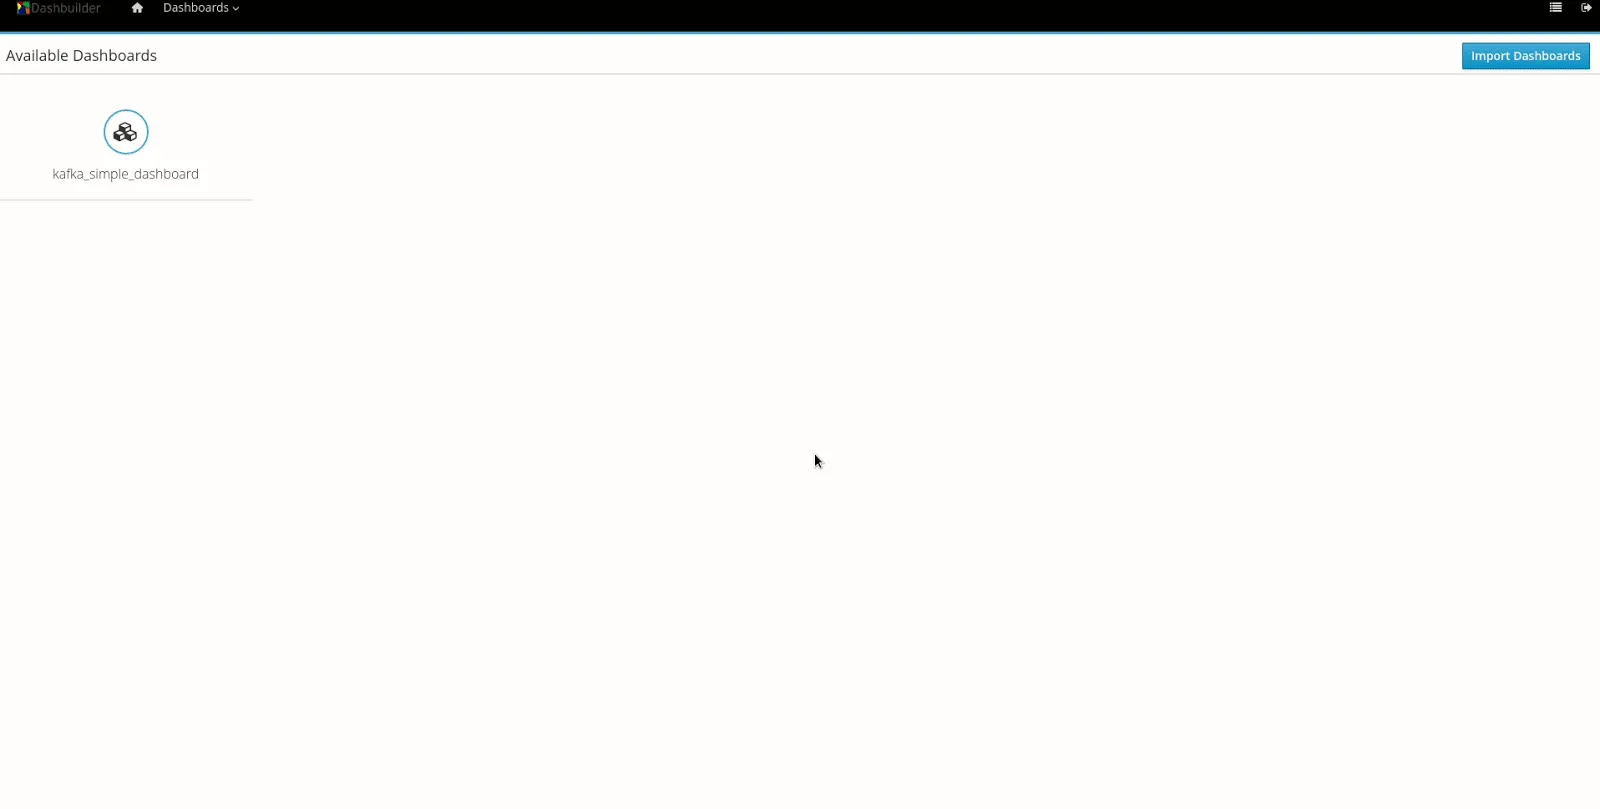
If you followed the steps above to set up Kafka you can import the Kafka Simple dashboard in Dashbuilder Runtime and it should work.
Conclusion
In this post, we show how to create Kafka data sets and Dashboards in Business Central and how to import it in Dashbuilder Runtime. With this new feature, we can monitor all the parts of a business process when it uses Kafka to identify bottlenecks or simply monitor any Kafka installation from Business Central.