
Innovative solutions for predictive maintenance
Blog: Capgemini CTO Blog
Companies will save up to USD 630 billion by 2025 thanks to predictive maintenance. These savings will be attributable to the reduction of breakdowns and maintenance and the increase of component lifespan. This article provides an overview of methods and algorithms for this technology in order to make it easier to understand and apply this revolutionary solution and see the bright future it offers industry.
Currently, maintenance in industry is mainly split into two categories:
- Preventive maintenance consists of defining a maintenance schedule in advance to inspect and/or change machine parts without knowing if they are really at the end of their useful life in order to avoid any standstills. In some cases, this can be economically harmful to a company, which must change various components and suffer equipment unavailability.
- Curative maintenance consists of replacing a part only after a defect is detected. The downside of this method is the risk of stopping the company’s production and losing revenue.

Predictive maintenance aims to improve upon these strategies by anticipating a failure before it occurs. To these ends, an artificial intelligence algorithm models a component’s lifespan so that the user is always aware of the state of wear of the equipment. By defining a threshold weighted by several factors – such as the difficulty of the supply chain, the duration of an industrial system immobilization, or cost – the company can mitigate risk and optimize maintenance and stock management based on cost, impact, and risk.
Research carried out in the field of predictive maintenance has more than quadrupled since 2010, making Industry 4.0 one of the biggest challenges of big data. To reduce maintenance costs, major industrial groups have implemented sensors to monitor weak signals from their machines (i.e., vibration, oil, engine temperature gauges) and anticipate failure using artificial intelligence.
One of our assignments explored the possibility of applying predictive maintenance to fleets of off-road vehicles. We collected several months’ worth of vibration data for several vehicles, each of which had been used with varying intensity both on road and off road in the mountains.
The response to a predictive maintenance problem often follows the same methodology. It is based on monitoring weak signals characteristic or representative of the machine’s behavior that could cause its failure:
- Supervision of a machine’s characteristic signal. For this, a sensor periodically provided data on vehicle vibrations.
- By characterizing normal vehicle use, algorithms made it possible to detect unusual situations such as, but not limited to, a violent shock, continuous vibrations over a long period of time, or intense use.
- Tracking and analyzing technical events relating to these vehicles enabled us to identify correlations between identified failures and detected vibrations.
Using this process, we modeled the state of wear of each vehicle’s functions (mobility, electronics, sensors, etc.) and were able to estimate the remaining component lifespan at any given time.
For many years, we assumed that machine components wore out according to linear regression, a parametric law such as the Weibull distribution or an exponential curve. This works when we try to characterize the state of a system that always has the same operation – for instance, a cooking robot cutting the same food. Using statistical methods, it would be easy to anticipate the lifespan of such a robot. However, this method does not apply to our project due to the environmental diversity in which our vehicles operated.
Thanks to artificial intelligence, we were able to highlight several events considered as abnormal:
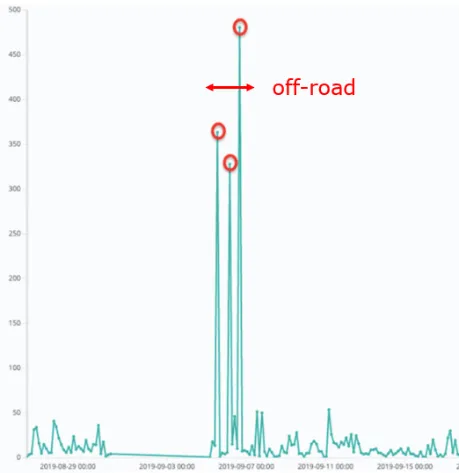
- Algorithms such as “isolation forests” applied to time series allowed us to detect anomalies. We could then determine the type of environment in which our vehicle operated (i.e., on road or off road).
- By correlating the failures with the vibrations that occurred just before a failure, we noticed that certain characteristic events could cause the failure of even relatively new components:
- A huge shock (as compared to usual use)
- Higher-than-usual vibration intensity over a long period of time.
This analysis emphasizes the idea that a component’s lifespan is heavily contingent on the events that happen during use. For example, a car tire running on a road at low speed will have a much greater lifespan than the same tire running on a rocky surface with high vibration.
It is impossible to model the wear of a component with a non-contextual statistical law. This is especially true when we analyze the set of events showing a non-constant lifespan between a component’s installation and its failure.
This problem is well known in the world of medicine. Indeed, scientists encounter this type of constraint when calculating life expectancy. Just because the average life expectancy in France is 82 does not imply that every French citizen will reach this age. The average age does not capture enough of reality to enable individual prediction. Scientists have used artificial intelligence algorithms modeling a person’s life expectancy based on their lifestyle (i.e., practicing sports, smoking, etc.). The lifestyle can be assimilated, in some ways, to the events quoted above through the components.
By adopting one of these survival models, AFT Weibull (or the Accelerated Failure Time model), to our problem, we modeled the characteristic lifespan for each component and designed each vehicle functions’ wear.
Component wear is defined by its survival analysis; in other words the probability of a failure occurring over time, according to distinguishing factors of the pattern (elements influencing the estimation). Each characteristic event affects the probability of failure, as modeled below:
![]()
Each family of components has the same probability of failure for the same conditions, distance covered, and operational time. This is what the first factor calculates. Nevertheless, as previously shown, several events intrinsic to the component increase or decrease its probability of survival. The purpose of factors is to model the impact of these events on the probability of failure (k being of the number of characteristic events).
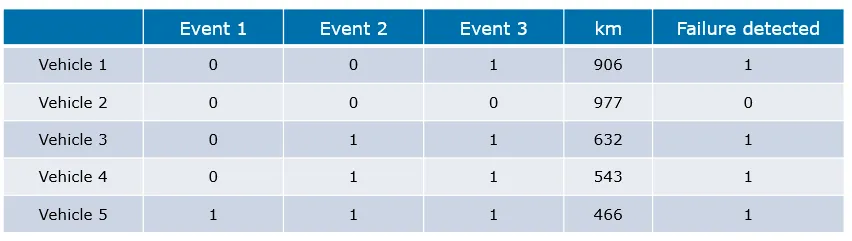
To estimate these parameters by the machine learning methods of maximum likelihood, we first designed a dataset. Because we had data on all undergone events for each component since its installation, it was easy to define the failures. These values were encoded to establish whether the event is characteristic of how the vehicle is operated. The table below summarizes these elements. To improve our models, we added the right-censored data (i.e. the component for which no failure was detected).
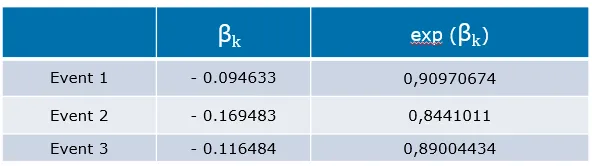
After training the model, we have the lifespan and the amount of each factor for each component:
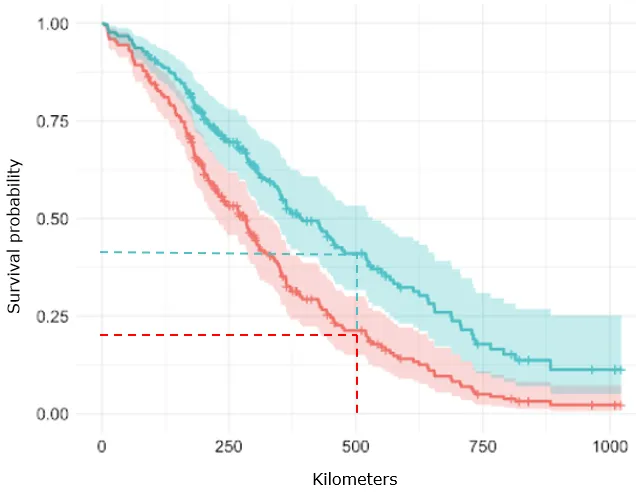
In this example, one vehicle was primarily exposed to low-intensity shocks and the component wore out after 500 hours of operation (about 60%, meaning that the probability of survival is 40%). A second vehicle was subjected to more intense use, and wear increased to over 75% while the probability of survival fell to less than 25%. With this information, the user can optimize his fleet based on vehicle operation – the first vehicle would be allowed to continue to run until the original threshold is reached whereas a reminder to change components would be sent earlier for the second vehicle.
In addition, future wear can be estimated according to how the vehicle will be used. To this end, it is necessary to define the targeted type of operation (intensive or not) and the kilometers driven or operating hours.
We conclude this article with an example of how this study was applied to a company renting quads to its customers according to two options: a quiet and calm ride by the sea and a more intensive ride through the mountains. The company deployed sensors on all its vehicles, allowing it to track vibrations. Thanks to this decision-making tool, the company has been able to:
- Monitor any weak signals. Thanks to the correlations produced, an alert is sent whenever an unusual situation is detected.
- Analyze the fleet condition and optimize stock management:
- The company is aware of function wear for each vehicle at any given time and will receive, thanks to the definition of a specific threshold, a recommendation to change a component whenever necessary.
- In the long term, the company will have an idea of the failures that these vehicles may encounter, making it possible to optimize stock management.
- Select the right vehicles to rent to their customers. If five quads are needed for high-intensity exercises, those with the highest lifespan (or the lowest wear) will be proposed to anticipate failure.
With the ability to conduct such analyses, it is no surprise that the predictive maintenance market shows an overall strong performance with a double digit growth rate. More and more industries are implementing sensors in their machines to oversee their characteristic data and applying AI to save time and money.
For more information, please reach out to the author, Mickael Nunes, Lead Data Scientist at Capgemini.