
Improving COVID-19 Hospital Operations with Analytics
Blog: The Tibco Blog
Reading Time: 3 minutes
Data science and analytics have helped business leaders stay informed and predict trends during the COVID-19 pandemic. Michael O’Connell, TIBCO chief analytics officer, recently sat down with two TIBCO customers and our partner Syntellis, to talk about the exact impact data science is having on helping health care systems cope with the pandemic.
Michelle Kannapel, Director, Business Intelligence & Financial Analytics, Norton Healthcare session:
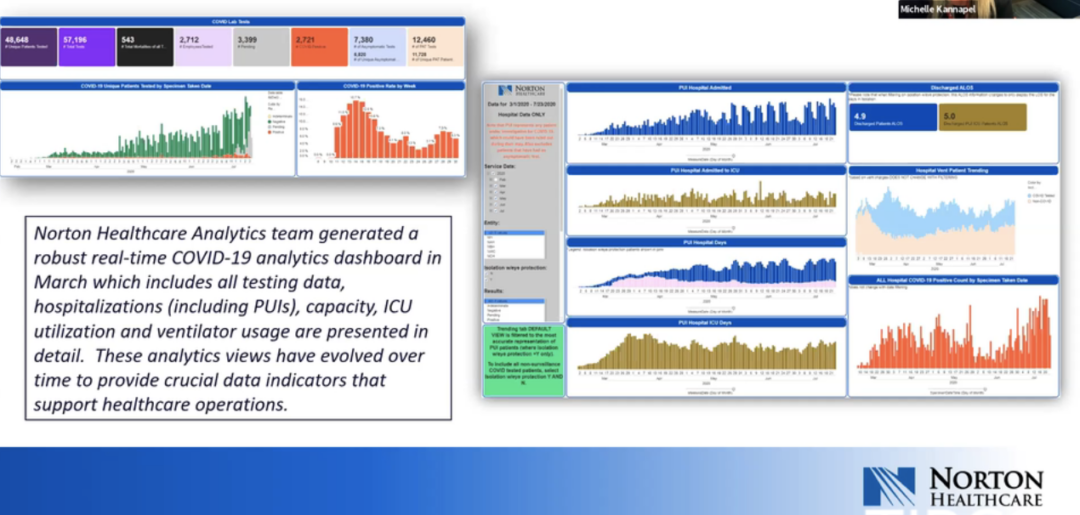
“We are the largest healthcare provider in our service area and we also run the COVID-19 hotline for the state. So data and analytics are extremely important. We have to monitor this.”
On March 13, 2020, at the start of the outbreak, Norton mobilized their command center, standing up a dashboard using TIBCO analytics software that connects directly to their medical records system, Epic. TIBCO software is able to pull data in real time to refresh the dashboard, giving them a wealth of up to date information to monitor the pandemic and the spread.

“Our command center, led by Mike Gough Exec VP and COO Norton healthcare uses all of this operational data and COVID-19 analytics to help us be prepared for what may come next and monitor, measure, and predict COVID-19 and take care of our community and employees. TIBCO helps support that command center each and every day.”
Eric Phillips, CSM Senior Consultant, & Cliff Mika, Senior Consultant, Operational Performance Improvement, Baptist Health session:
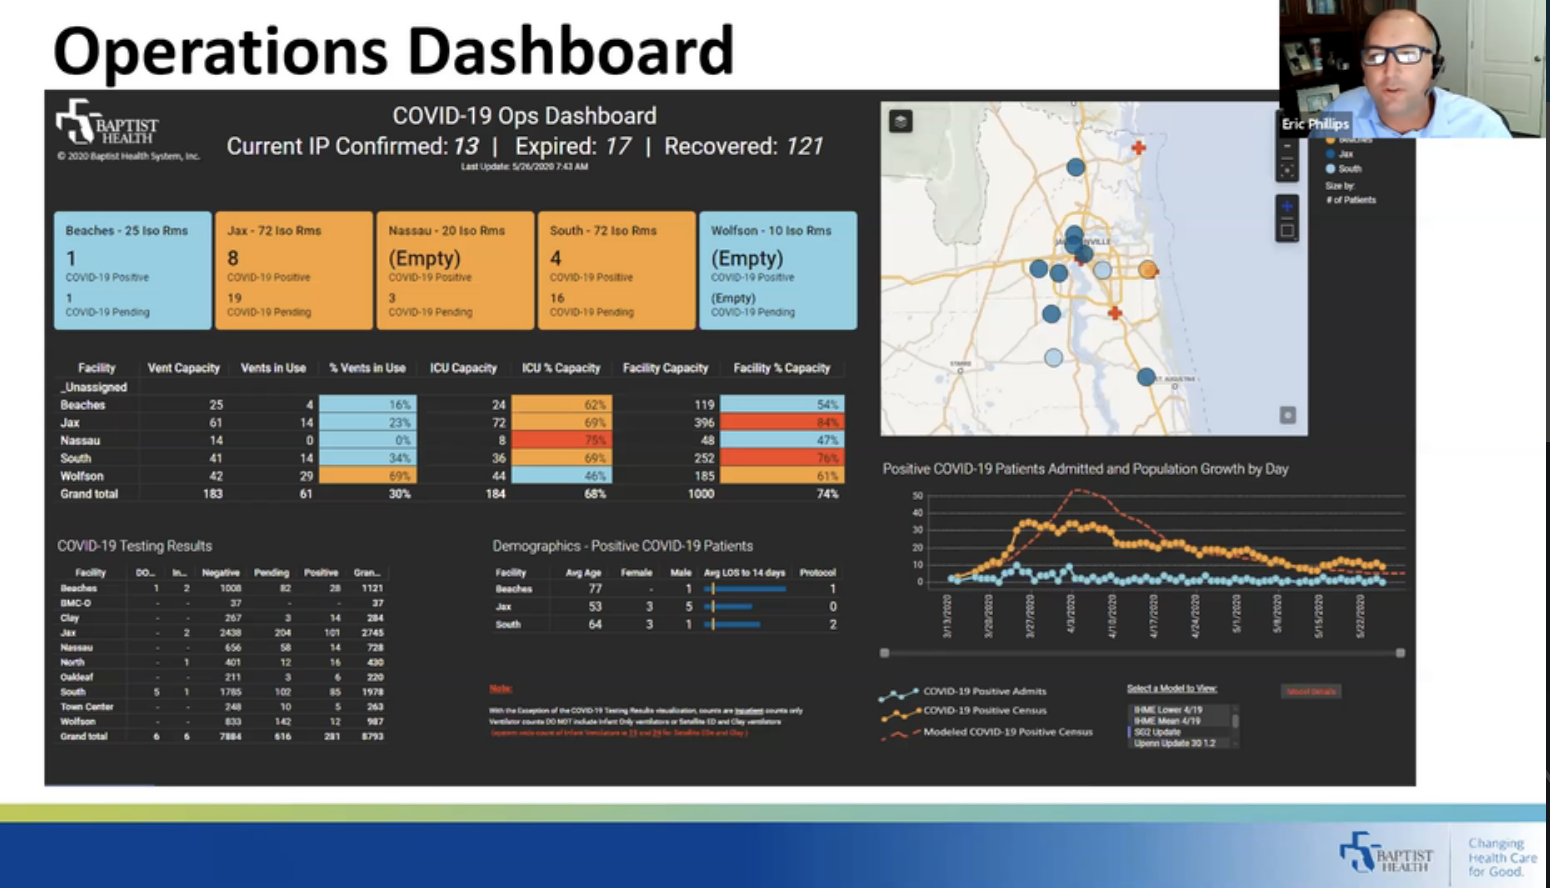
Cliff and Eric from Baptist Health explained that their initial support also began back in March when they set up dashboards using TIBCO software to monitor the spread.
“The original intent was to provide COVID-19 situational awareness across the health system including things like positive tests, how many isolation rooms we have, what the utilization was, overall capacity, and to compare trends of census over time compared to various models.”
As it evolved, the dashboard now helps them predict their readiness to respond to surges in the pandemic. They developed a series of leading indicators and KPIs (hospitalizations, # of positive tests, community activity, reproduction rate) measured by how they are performing from the last seven days, and compare them to their supplies of ventilators, beds, etc.
They now have an easy-to-use visual guide to quickly indicate if the health system is prepared to deal with surges.
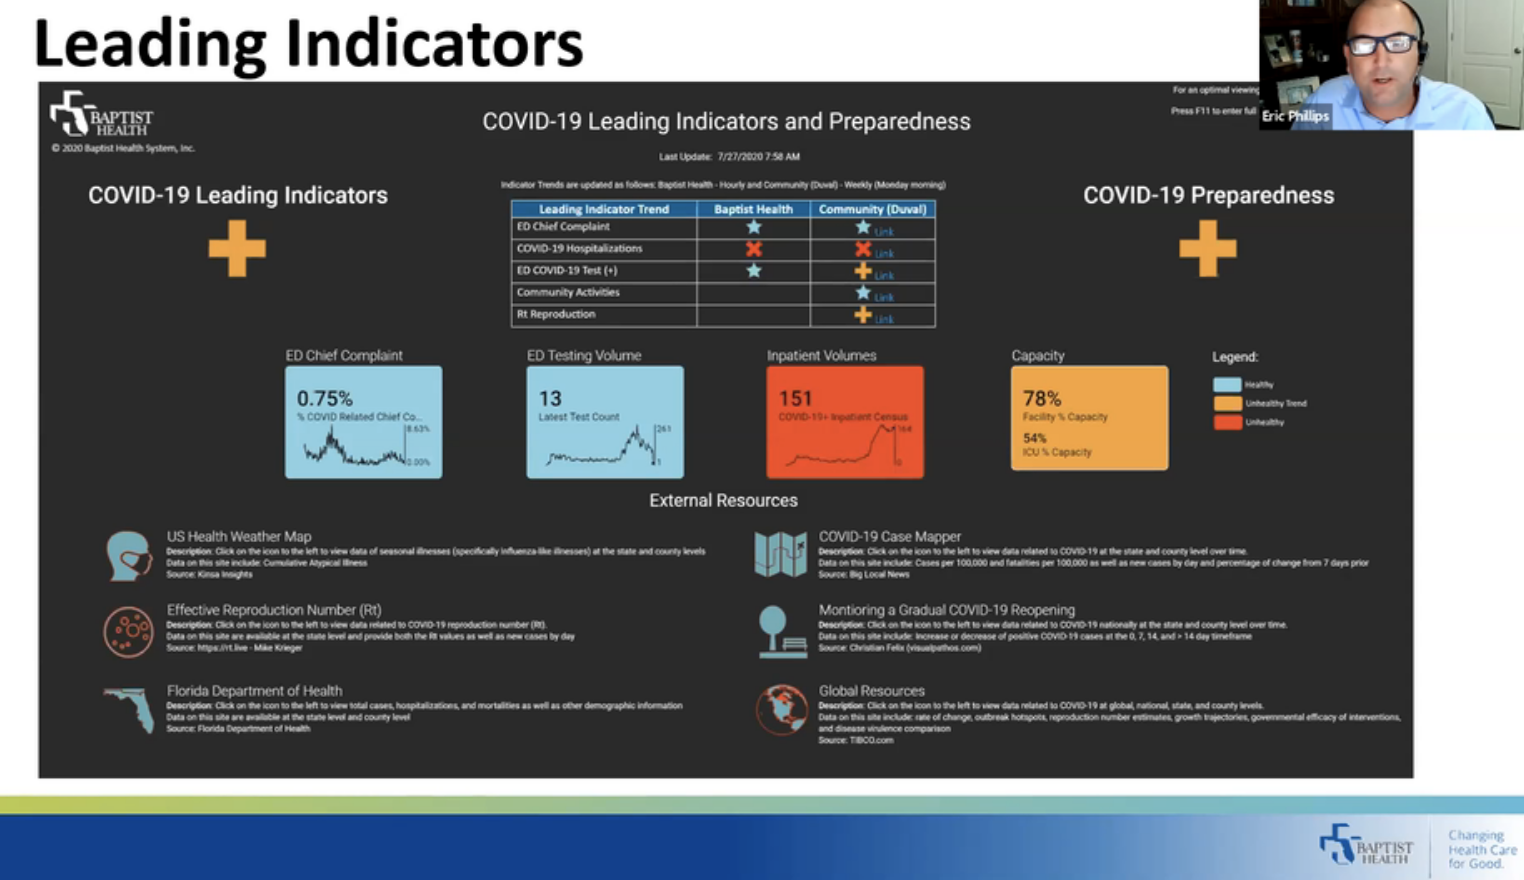
As you can see, on the left is the demand on the system (yellow plus sign under COVID leading indicators) and the right is the team’s preparedness and supply. If the right side goes to a negative sign, they immediately know they have to act and the data shows them exactly what they need to do to deal with the surge.
Being Agile in the Time of COVID
For both of these customers, their audiences were wide-ranging from executives to front-line staff to government reporting, and their needs were diverse. The executives needed forecasting and planning, operations needed supply chain information, and ways to optimize staffing, healthcare workers in the trenches needed to make sure there were available beds. And, a myriad of local and state government reporting was required.
“We had to act quickly in an agile way to make sure audiences’ needs were met. TIBCO Data Science enabled us to meet those needs,” said Cliff.
Michelle continued: “We have a heavy reliance on analytics, and the results make all those sleepless nights worth it. We’ve had a 24% increase in the utilization of all our dashboards throughout our TIBCO application. It’s been very challenging but we are proud to serve our employees and community.”
“We had to act quickly in an agile way to make sure audiences’ needs were met. TIBCO Data Science enabled us to meet those needs,” said Cliff Mika of Baptist Health.
Click To Tweet
For more on how data science and analytics help Norton Healthcare and Baptist Health deal with the pandemic and optimize their operations, watch the webinar. You can also visit our COVID-19 analytics hub for up-to-date information.
Leave a Comment
You must be logged in to post a comment.