
How to start your first dashboard
Blog: Aris BPM Blog
Using dashboard you can monitor and analyze relevant information easy and quickly. You can create individual dashboards that tell the whole story by giving a complete overview of important information. You can also visualize data in context and determine if reality match planned values so you can see where to make improvements.
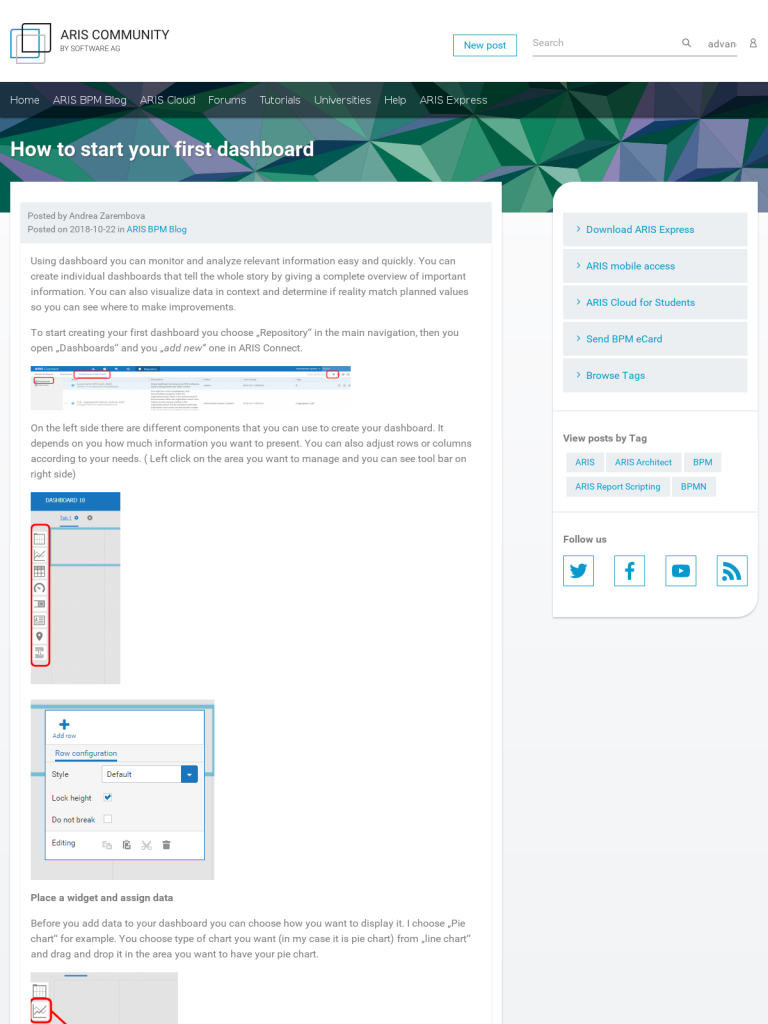
To start creating your first dashboard you choose „Repository“ in the main navigation, then you open „Dashboards“ and you „add new“ one in ARIS Connect.
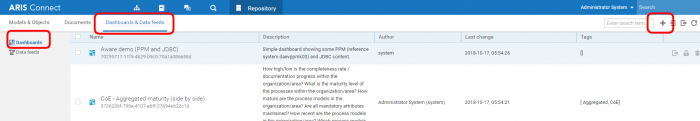
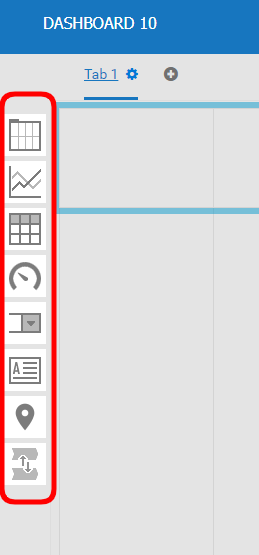
On the left side there are different components that you can use to create your dashboard. It depends on you how much information you want to present. You can also adjust rows or columns according to your needs. ( Left click on the area you want to manage and you can see tool bar on right side)
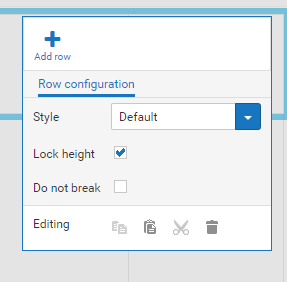
Place a widget and assign data
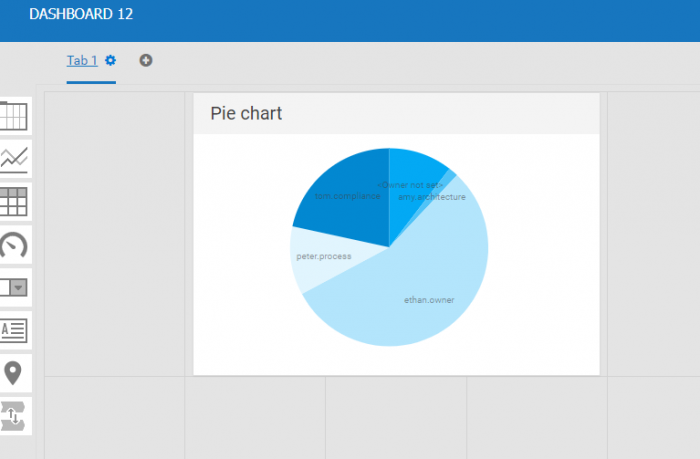
Before you add data to your dashboard you can choose how you want to display it. I choose „Pie chart“ for example. You choose type of chart you want (in my case it is pie chart) from „line chart“ and drag and drop it in the area you want to have your pie chart.
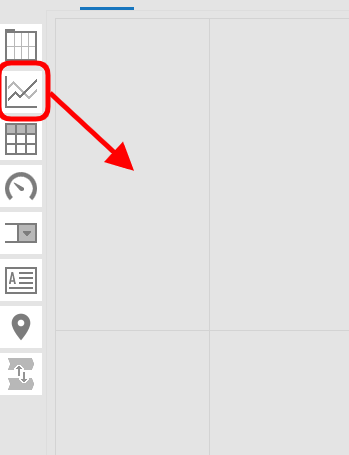
In one of next blog posts I will show you how to create a data field and style your dashboard according to your preferences. Now we take a look at how you place a widget and assign data.
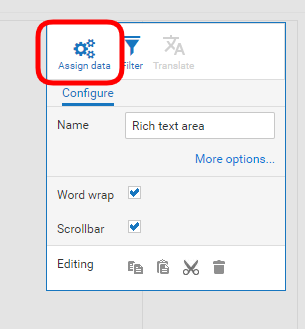
To add data to your dashboard you use icon „assign data“ ( left click on text area and you have tool bar on the right side)
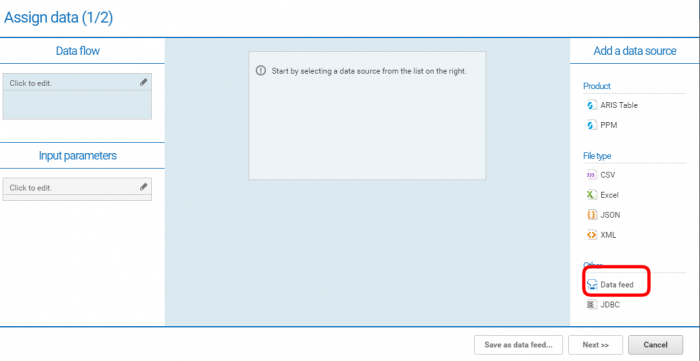
To add data you need to choose data source. On the right side you have more options. I use data feed, which I have to prepare before starting creating the dashboard. I will show you how to do it in one of the following blog posts.
Now you can choose your data feed from the list of data feeds we have created before. I choose one of the existing data feeds which I can also adapt according to what I want to display on dashboard.

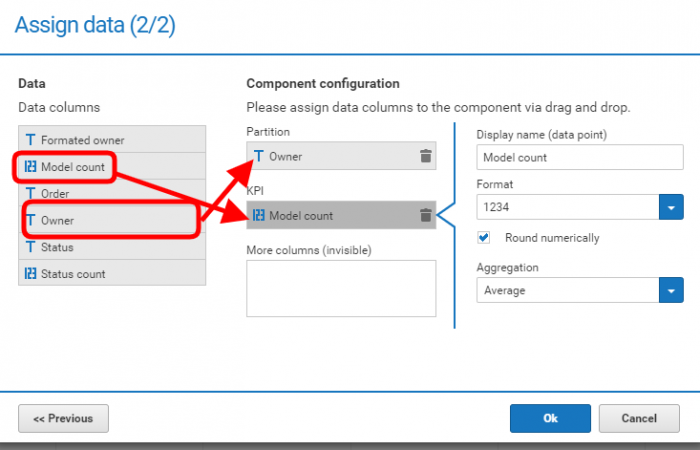
On the right side I have opportunity to use data operations to adjust the data feed to my needs. Once I have the data feed prepared I click “next” and choose parameters that will be displayed on dashboard.
After that, wanted information will be displayed on your dashboard. You can also have different graphs, numbers or results of some statistic operations etc. displayed on your dashboard. I will explain you how to do that in another blog post.
Leave a Comment
You must be logged in to post a comment.