
How to improve process with cumulative flow diagrams
Blog: Monday Project Management Blog
We all want our projects to run smoothly and efficiently, but it can be tricky to get a handle on how things are really going.
A cumulative flow diagram is a visual way to improve the effectiveness and efficiency of your team.
Perhaps there’s a bottleneck you’re not aware of, or people are drowning with too many tasks? Or maybe you just want a cool visual of the last sprint?
Read on to explore how to use cumulative flow diagrams to solve process improvement – starting with a quick definition.
“Cumulative Flow Diagram” is a part of our Project Management Glossary — check out the full list of terms and definitions.
What is a cumulative flow diagram (A quick recap)
A cumulative flow diagram is a visual representation of your team’s tasks and the time to complete them. The horizontal axis represents a time period and the vertical axis represents your team’s tasks. It helps teams to monitor how stable their workflow is, anticipates bottlenecks, and makes processes more predictable.
As the name suggests, the diagram accumulates every task so that you can understand the performance of teams and tasks better. For instance, by visualizing how tasks accumulate over time, you can see where to make your process more efficient.
How do cumulative flow diagrams solve process issues
It can be hard to keep an eye on the bigger picture to see what’s working, what’s not, and whether you’re on track to deliver on time.
The good news: Cumulative flow diagrams visualize your tasks, based on which stage they are at, to determine how fast you’re working and what needs changing to meet all your targets.
But what else can you do with them?
Let’s get into it.
#1: Calculate lead cycle times for your project
Cumulative flow diagrams collect every task in your workflow to visualize three critical metrics:
- Cycle time: In short, this is the total time your team takes to complete each task from beginning to the end. This helps you to see where you can optimize your workflow to reduce cycle times.
- Work in progress: This is the number of tasks your team actively handles at a certain time. Cumulative flow diagrams then visualize inefficiencies, such as when your team has too much or too little work in progress at any given point.
- Throughput: This is the number of tasks your team completes over a given period. As this is the ultimate measure of your team’s productivity, cumulative flow diagrams show where you can align efforts and resources so that throughput increases over time.
#2: Determine the bottlenecks in your workflow
With too much work in progress (WIP), your project will face a bottleneck. Let’s say your record for carrying out a particular task is just four days with five experts working on it. But, looking at a cumulative flow diagram, you discover this task has remained on the WIP for over eight days, with four experts working on it.
With that insight, you’re able to see that there are bottlenecks that need to be removed. You can then dig into your process to see what needs fixing.
#3: Improve the performance of your team
Similar to identifying bottlenecks, it can also improve team performance. For example, teams can monitor the flow of work through its stages helping to predict disruptions in the progress of work.
When a problem area is detected, your team can then quickly make changes and continue to work effectively.
#4: View tasks by fastest or slowest in terms of time spent
Using a flow-based system like Kaban, it is essential to keep a steady flow of work moving through your process.
Finally, let’s look at how to actually create cumulative flow diagrams and other data visualizations.
Use data visualizations with monday.com
A great starting point is to use Kaban boards to divide the workflow of a given project into three columns: ‘To Do’ tasks, ‘Work in Progress’ or WIP tasks, and tasks that are ‘Done’.
This approach gives you an idea of how many tasks are at each stage of the process and should go up or sideways proportionate to the number of tasks going through each stage.
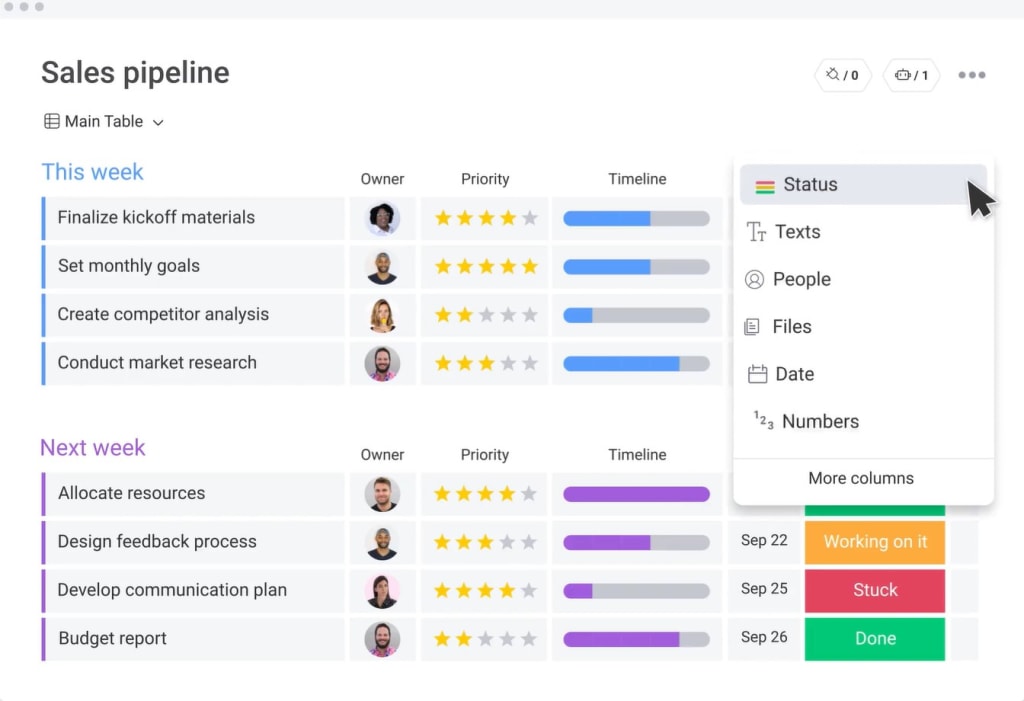
Additionally, Charts are a great way to see the analytics side of your workflow. See how well your team members are performing, how fast your tasks get done, how they change over time, and more.
In this example, we are using a sales pipeline to visually track the progress of all the deals our sales team is currently working on.

If you still have unanswered questions, take a look at the most frequently asked questions, below.
Frequently Asked Questions
What are the benefits of cumulative flow diagrams?
When done correctly, you should easily identify the stability of your workflow and any problem areas to address. This will tell you which areas need your attention to maintain continuous improvement.
Why are cumulative flow diagrams useful?
Cumulative flow diagrams provide you with the tools to improve the overall productivity and efficiency of your team and your projects.
What can you do with a cumulative flow diagram?
Essentially, a cumulative flow diagram allows you to visualize your entire workflow to diagnose problems within your processes. It can help reduce your average cycle time, increase your teams outputs, and manage WIP limits.
Improve processes today
Whether you’re managing projects using Kaban or other project management methodologies, a cumulative flow diagram is a ‘must-have’.
It simplifies progress tracking while identifying problem areas to address.
The post How to improve process with cumulative flow diagrams appeared first on monday.com Blog.
Leave a Comment
You must be logged in to post a comment.