How to analyze data with queries and spreadsheet functionality
Blog: Aris BPM Blog
Today I want to say a few words about how to use the “Query” functionality. It is not a new feature, but it is a great functionality to analyze the data in ARIS, and I would like to share it with you.
By running queries you can easily illustrate the complex relationships between database items in a graphic. In other words, queries enable you to visualize all relationships that exist in a database with just a few mouse clicks.
To create a new query, you have to follow these steps:
- Click
 New >
New >  Query. The Query Wizard opens.
 - Select the database for which you want to define the query.
- Log in, if required.
- The Query 1 tab opens.
- Click
 Query in the bar panel if the bar is not activated yet.
 - In the Start box enter the name of the item you want to start a query for. This can be for example, a group, model or object.
- Click on a successor or bullet in the list.
- Add any number of steps or already existing queries to this query. All items are represented graphically on the Definition tab.
- Click
 Start query on the Query tab bar.
 - Enter for example, the name of the model or click an entry in the list of suggestions. The query is started. Objects are represented as ARIS default objects.
- Select the layout for displaying the result. This layout will be used as standard to display the result for all queries you run in the future.
- Save the query, and if you wish that other people can use it as well, publish it to everybody.
You can start public queries for every database of a tenant.
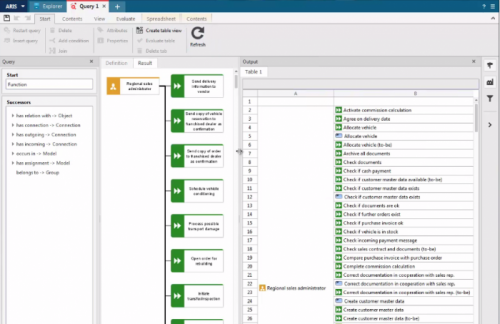
Besides showing them in a graphic, query results can also be displayed as a table and saved as spreadsheet models:
Furthermore, if you want to enable automatic calculations in your table output, you can define a table output template based on the query. Once such a template is created and saved, queries can be started that deliver full table overviews, for instance with ready calculation of values.
I will publish some query examples for Customer Experience Management shortly. In these posts I will explain in more detail how you can define and use queries, and what additional use cases you can serve with queries.
Leave a Comment
You must be logged in to post a comment.


