
Exploring NYC Traffic Accidents with Spotfire X
Blog: The Tibco Blog
Last month, Forrester held its inaugural Data Strategy & Insights event in Orlando, FL in which analytics practitioners, enthusiasts, and leaders came together to learn about new ideas and exchange best practices. At the event, TIBCO® Spotfire X gave a product demonstration that exemplified innovations happening in the analytics and BI market. The concept of the demonstration was very straight forward:
- Ingest the data from the publicly available motor vehicle collisions in New York City dataset provided by NYPD.
- Analyze and prepare the data.
- Use machine learning to speed up insight discovery.
Below, we talk about the specifics of each part of the demo and how Spotfire X excels at each one of them:
Ingesting, Analyzing, and Preparing Data
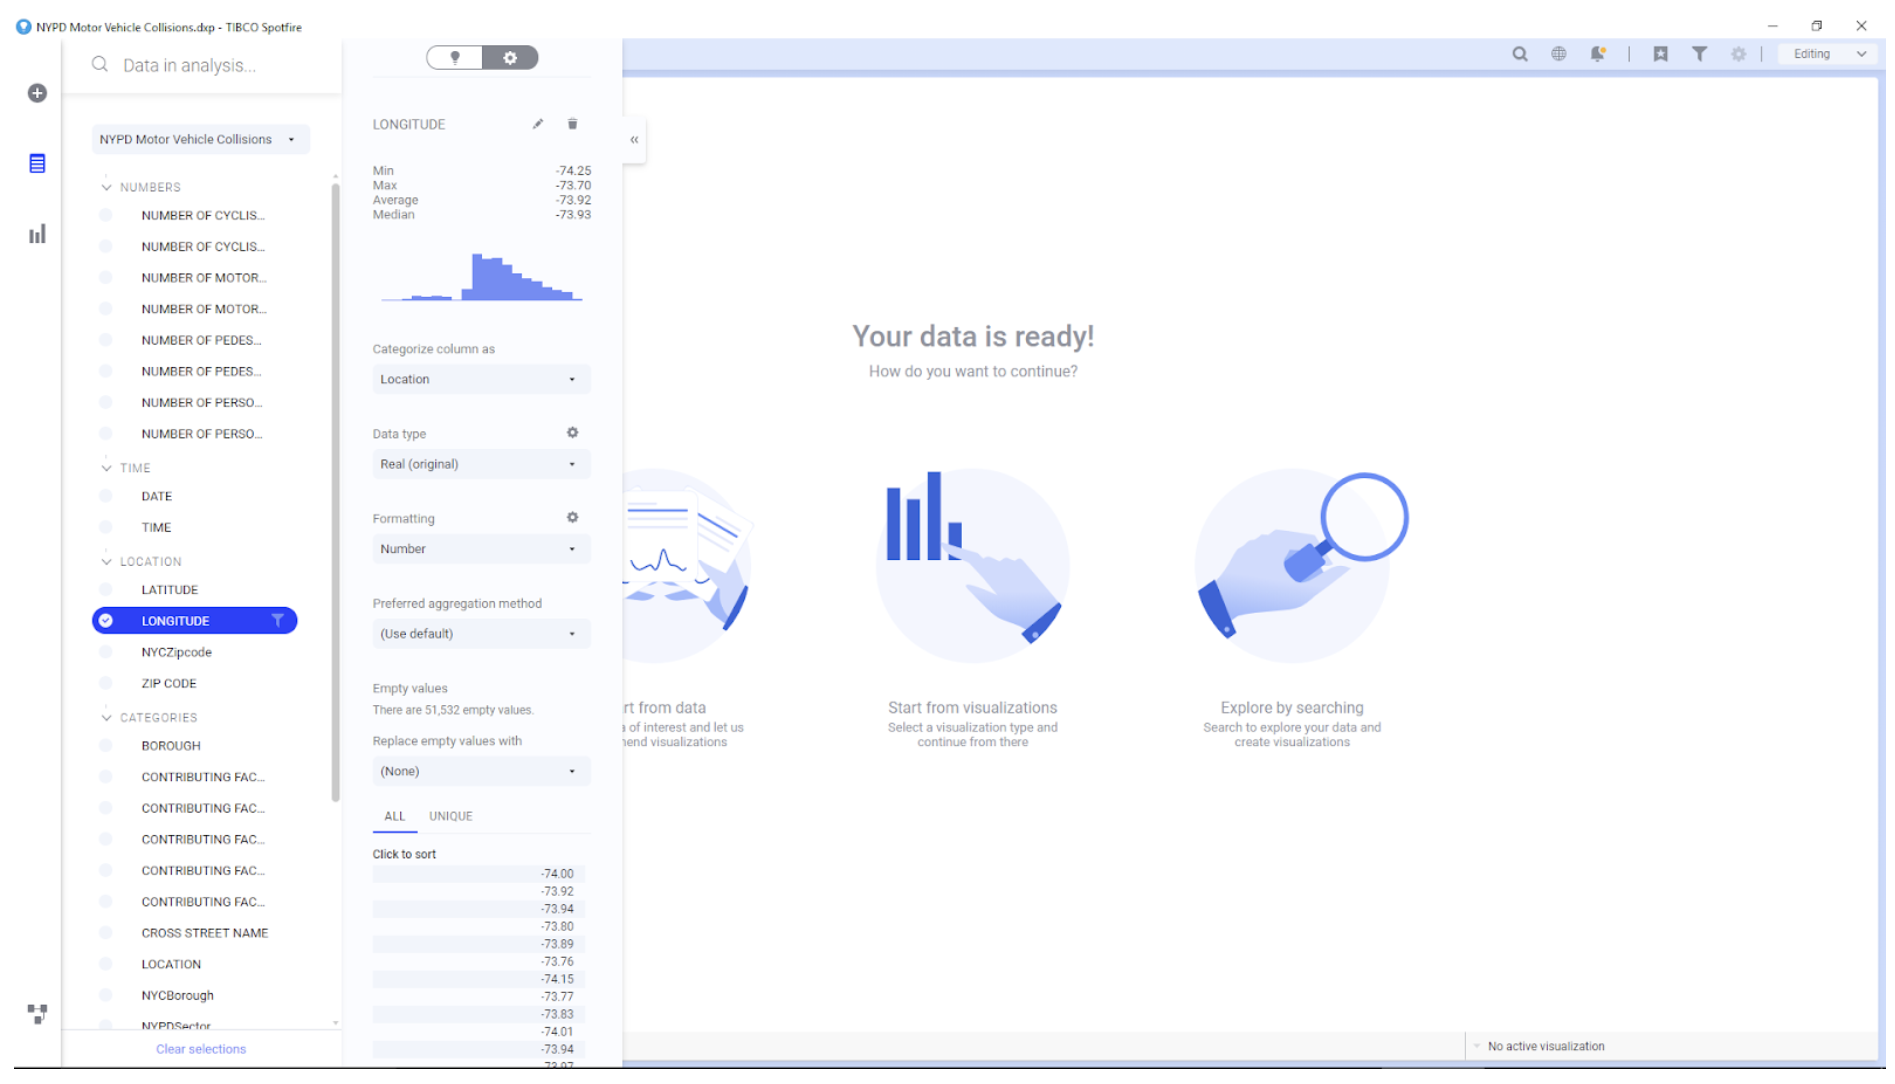
As the first part of the demo, the open dataset could be downloaded as a CSV file or could also be ingested using the OData connector for Spotfire. The dataset, containing 1.4 million rows, was ingested by Spotfire’s in-memory engine in just a few seconds.
The dataset contained information about injuries and deaths of pedestrians, cyclists, and motorists by time and location as well as contributing factors for the accidents. Thanks to the newly released Spotfire X, we had a data panel that gave a nice view of the data profile as a value histogram. It also gave us the opportunity to rename columns, change the data type, etc. – all from one place. Surveying a dataset for data quality problems is an important step because if the incoming data is bad, the analysis results will be bad as well. With Spotfire X, we could see that the data we had was good.
Spotfire X excels at data preparation and was recently cited as a leader in The Forrester WaveTM: Data Preparation Solutions, Q4 2018.
AI-Powered, Search-Driven Analytics
Spotfire X offers search-driven analytics. In this case, as soon as the data was ingested, we were able to just type a key phrase that we were searching such as “injured by borough” and we were instantly presented with relevant visualizations. These automatic visualizations are powered by a brand-new Artificial Intelligence (AI) engine within Spotfire X.
Additionally, we were able to add any of these visualizations to the analysis with just one-click by the user. The AI engine also gives recommendations for relationships between the selected variable and others that users might want to further explore. By using these recommendations, we were able to build a fully interactive dashboard that allowed us to drill-down, mark, and filter data in a very intuitive way.

In Spotfire X, another of the key strengths is the ease with which location analytics can be done. For example, a map chart like the one shown below can be configured to show, not only the boroughs at the top level, but as one zoom in you see the zip codes, NYPD coverage regions, and the individual accident locations.

Bicycles always lose in an accident: Using machine learning to speed up insights
And now for the final part of the demo: how Spotfire X uses machine learning to get to insights faster. Spotfire X has built-in predictive analytics like one-click Holt-Winters forecasting for accident trends in which users can specify confidence intervals around the forecast and also tweak the model to take into account seasonality or other specifics. Spotfire X can also take advantage of numerous packages that are available through TERR (TIBCO Enterprise Runtime for R) that is embedded in Spotfire. Of course, Spotfire also integrates with TIBCO Data Science with comprehensive in a database and out of database advanced analytics capabilities.
We demonstrated how one can zoom in to hot spots of an accident and even look at the Google Street View of the accident location right from within Spotfire X. We saw a number of persons injured highest during morning and evening rush hour commutes across all boroughs – Brooklyn, Bronx, Queens, Staten Island, and Manhattan. It was quite interesting to see that on Sunday mornings at 4:00 AM, there is a spike in injury-causing accidents in Queens. Also interesting to see was that on Wednesdays, folks in Staten Island rush to catch the early morning ferry into Manhattan and therefore, get into accidents more often.
For deeper analysis, we used Random Forests classification package and techniques like hierarchical clustering that are provided out of the box by Spotfire X and came up with quite a few interesting insights. For instance, if you’re driving a station wagon and you fail to yield the right of way, you are likely to get into an accident. However, the two most interesting insights were:
- SUV drivers losing consciousness are not in as much danger as he/she is less likely to be injured.
- Bicycles always lose no matter what circumstances or which borough you are riding the bicycle in. Kudos to all those messengers in the city for all the risks they take!

Try out the new Spotfire X with a 30-day free trial.
Leave a Comment
You must be logged in to post a comment.