
Defining The Scope Of Business Analysis With A Context Diagram
Blog: Business Analyst Learnings Blog
The main goal of all business analysts is to uncover unknown risks and requirements during the requirement discovery phase. But as many business analysts will surely attest to, sooner or later, the problem of scope creep inevitably arises, unless one takes concrete steps to prevent it.
On his website, Tom Ewer defines scope creep as, “the process by which a project grows beyond its originally anticipated size.”
Project Managers are not alone in their quest to manage scope creep; Business Analysts are concerned as well. In most cases, things start well enough, but as requirements elicitation progresses, stakeholders may begin to ask for more requirements, or they may even presume that the extra requirements fall within the scope of the project. In both cases, they may expect the costs and delivery time frame to be the same.
Scope definition is particularly important in keeping the project team focused on what matters. Because stakeholders have diverse problems and interests, it’s essential that the BA redirect conversations and inquiries to what matters by emphasizing the boundaries of the analysis area and the project.
Context diagrams define the scope of a project by drawing “the boundary between what’s in and what’s out for the project,” explains Karl Wiegers. “The scope identifies what the product is and is not, what it will and won’t do, what it will and won’t contain,” he adds. It should be considered a key deliverable even for very small projects, as those are most likely to suffer from the worst kind of scope creep.
The context diagram is simple to produce and indicates the business entities, external applications, staff, customers, suppliers that will interface with the project as well as the information flow in and our of the project or analysis area.
What Does a Context Diagram Look Like?
Context diagrams, also known as context-level data flow diagrams or level-0 data flow diagrams, are graphical, high-level representations that say nothing about how the system operates internally nor how it looks from the point of view of the end user. Instead, context diagrams show the boundary of the system, external entities, and data flows between these entities (users, software systems, or hardware components) and the system.
“Context diagrams have been around since the 1970s, since the days of structured business analysis and design, to describe the information exchanges between users and the potential business system,” says Phil Vincent in his article for Corporate Education Group. Precisely because a context diagram offers a concise high-level overview, it sets expectations among project stakeholders and forces business analysts to methodically and thoroughly assess requirements and the resources necessary for their implementation.
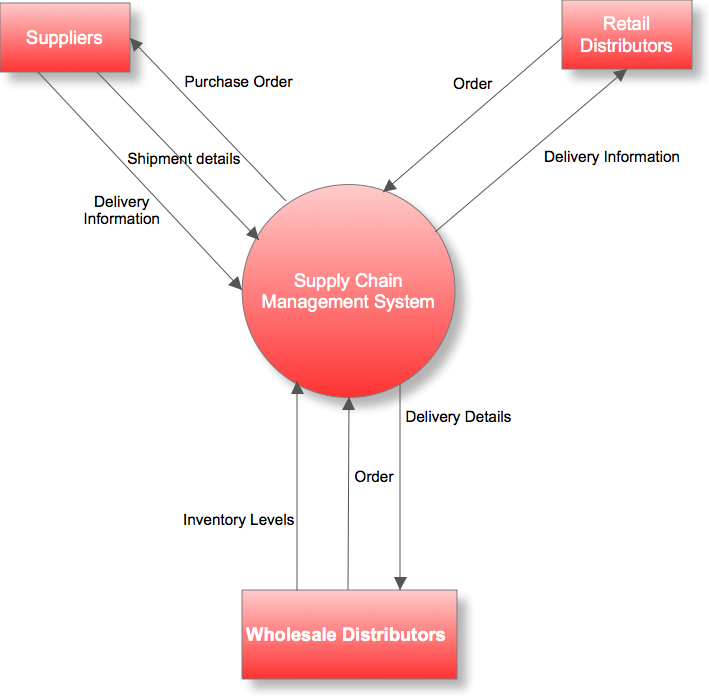
Think of your software system or project as a central entity affected by external agents or external entities. The objective is to show all the entities outside your system that interact with it, either by receiving data from it or transmitting data to it. It reveals nothing on internal processes. An example of a context diagram is shown below for a Supply Chain Management System:
See Data Flow Diagram: A Practical Guide for more on this
The context diagram can help the business analyst limit the scope of analysis to what is important. Identifying the information flows as well as the agents that will affect the project also goes a long way to help the business analyst understand what the requirements are, how the business works and the extent of the requirements elicitation effort.
Leave a Comment
You must be logged in to post a comment.