Customer Analytics Series #2: Segmentation Analysis with Customer Analytics Templates for Spotfire
Blog: The Tibco Blog
What can your customers’ purchasing behavior tell you?
Can you group your customers based on their past purchasing behavior to learn more about them?
The Customer Analytics Segmentation Analysis Template for Spotfire in the Customer Analytics Template series helps you answer these questions. Using the template, you can apply a clustering algorithm to determine customer segments and learn about the characteristics of each one.
Clustering is a technique used to group similar objects together. It is up to the person performing the cluster analysis to define which measures to use to determine similarity. For example, a marketing analyst may be interested to group her customers by the similarity of the quantity of products purchased in various categories. Clustering would then result in groups whose members have made similar quantities of purchases in similar categories.
Using data prepared by the Customer Analytics Data Pre-processing Template for Spotfire, the Segmentation Analysis Template lets you select the product categories to use for generating the segments. You can then specify the number of segments to identify and let the template’s clustering algorithm do the work for you. The template has a number of visualizations for you to analyze the segments that are found. Let us take a look at some interesting findings in the example that comes with the template.
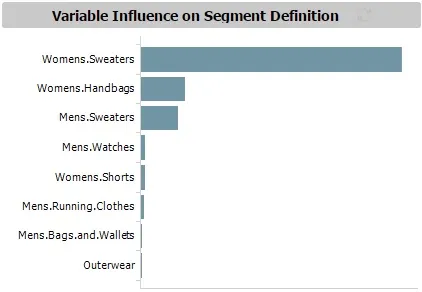
Which product categories are the most important in determining the segments?
Let’s assume we are the marketing analyst of the fictitious retailer whose data we are analyzing. The clustering algorithm has found 4 segments for us. Do we know which product categories are the most important in determining a customer’s segment? The variable influence chart in the figure below tells us that women’s sweaters, women’s handbags, and men’s sweaters are the most important categories that determine a customer’s segment.
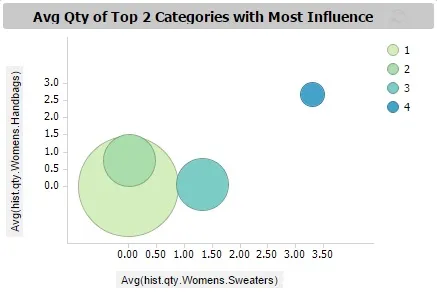
Which segment is the biggest or smallest?
From the plot in the next image, we get an idea of the size of the customer segments from the size of the circles on the plot. We know that Segment 1 is the largest while Segment 4 is the smallest. This plot also compares the average quantities of product purchased from the top two categories that influenced segment definitions. Segment 1 sits right on the origin—its customers did not buy any women’s sweaters and handbags. Customers in Segment 4, compared to those in the other segments, bought more of both women’s sweaters and handbags on average.
Who buys the most?
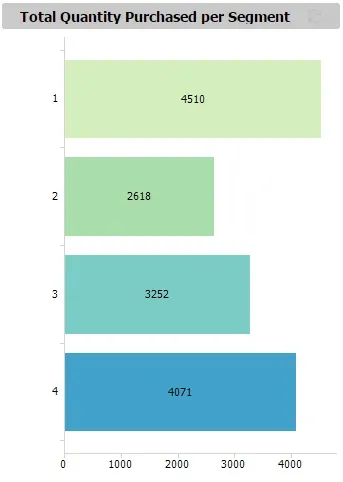
The bar chart in image 3 reveals another interesting finding about Segment 4. While it is the smallest segment, its customers have purchased a significant number of items compared to the other bigger segments. Compare that with Segment 1, which is the biggest segment.
Who buys what?
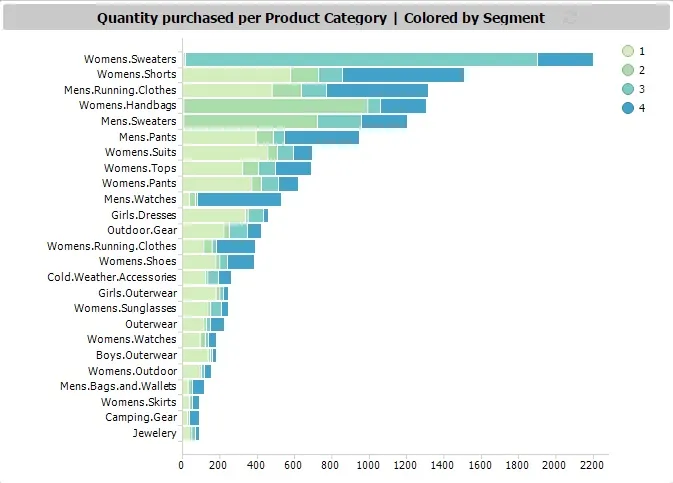
Figure 4 shows us a breakdown of the quantity purchased by each segment for every product category. Women’s sweater is the category with the largest quantity sold. Notice that a large proportion of purchases in that category were made by Segment 3. For women’s handbag and men’s sweaters, most of the purchases were made by Segment 2. Men’s watches sold by this retailer were mainly bought by one group of customers. Can you tell who they are?
Given what we learned, we can characterize the 4 segments in this manner:
Segment 1
- The majority of the retailer’s customers belong to this group
- They do not buy sweaters (men’s or women’s) or women’s handbags
Segment 2
- The retailer’s main customers for women’s handbags and men’s sweaters
Segment 3
- The retailer’s main customers for women’s sweaters
Segment 4
- The retailer’s main customers for men’s watches
- This is a small group, but customers here make high quantities of purchases
At this point, we probably have more questions about the customer segments than we did when we started. Is there an opportunity to sell sweaters and women’s handbag to Segment 1? Why is there a particular interest in women’s handbags and men’s sweaters by Segment 2? Likewise for women’s sweater by Segment 3? Questions aside, we also know that we probably do not want to neglect Segment 4 even though it has fewer customers because they purchase large quantities of products.
The analysis definitely does not end here. Using the example in the template, we saw that segmentation analysis has given us some insights to our customers. It has also helped us uncover some new questions to guide further analysis.
Would you like to do a similar segmentation analysis on your own data? Download the Customer Analytics Segmentation Analysis Template for Spotfire and give it a try. Keep up with the full Customer Analytics Templates for Spotfire blog series, with the first post on how to get to know your customers here.
(This post is the second of a series of posts on the Customer Analytics Templates for TIBCO Spotfire)