Best Visual Options for Process Mining
Blog: Jim Sinur
Until bots can be cognitive enough to complete closed-loop improvements on processes or data stores on their own, visualization for humans will be key for making process improvements. Today many of those improvements are made through data mining in real-time or after the fact by humans. They do it by setting tolerances and monitoring outcomes or looking at the visualization of process instances that travel through processes or collaborations. The best visual options for any organization will depend on their culture, maturity, and desired business outcomes. I've laid out three categories of process mining visualization techniques that typically match maturity levels. I have used examples from vendors to help sort out the options, so your favorite may have been left out of this post.


Basic Visualizations
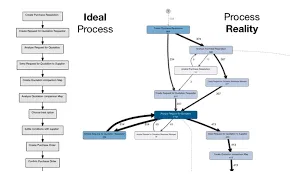
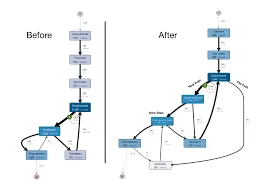
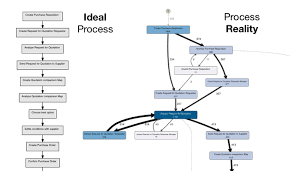
Basic visual analysis sometimes starts with an ideal process, sometimes called a "happy path", and look for the actual paths taken by a process. Organizations sometimes start with the outliers and try to reign them in closer to the ideal. Other organizations start with clusters of most common deviant paths and try to improve them. See the visualization below for a representation of this approach. Most organizations do a before and after, also depicted below. This shows the process before changes are made and the resulting process with deltas in certain instances.

Intermediate Vizualizations
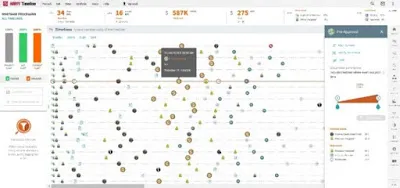
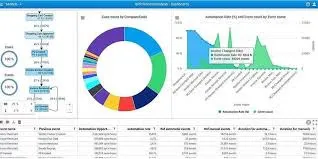
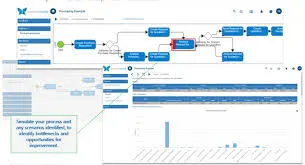
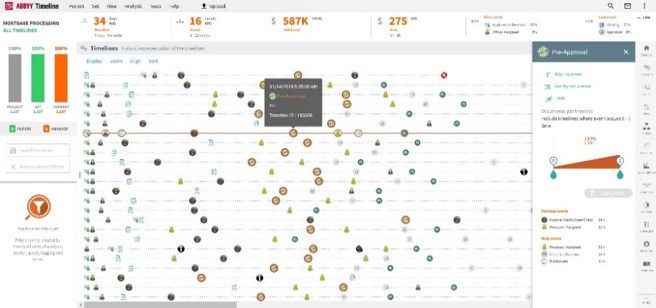
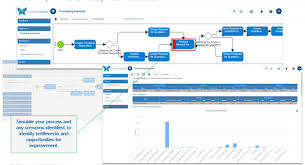
More mature organizations try to add important contexts to show the actual delivery made by processes in terms of key measures. One of the more important contexts, shown below, are the actions shown on a timeline. This gives "time to results" a high priority while counting key costs and resource utilization specifics. This is an effective way to eye-ball opportunities. Another key approach is to show the process instances in light of desired outcomes versus real outcomes also depicted below. This is the start of the journey to adding more intelligence to the process of mining efforts. Simple Step through visualization with or without simulation of proposed changes is another nifty approach pictured below.

Advanced Visualizations
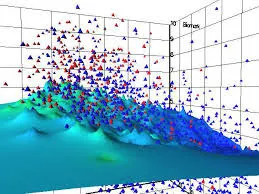
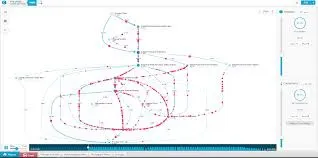
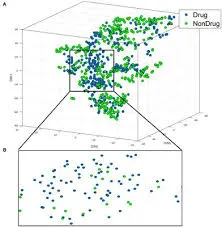
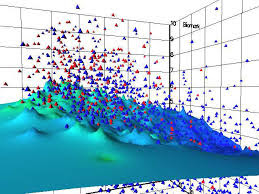
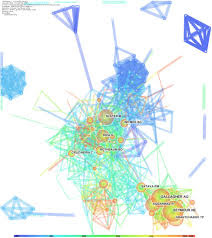
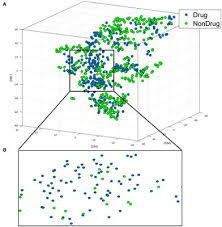
One of the proven visualization techniques is animations that attract humans to opportunities through either speed or color indicators. This typically shows choke points and bottlenecks, but there are additional uses to simulate alternatives to show the value of different change opportunities. See below for an example. Predictive analytics combined with virtual reality can be used to visualize points of view or personas to fine-tune processes from different perspectives walking through a process or journey as depicted below. For those organizations that want to learn as they go, they can add machine or deep learning to improve processes as depicted below.

Net; Net:
The visualization approaches can have a great impact on the resulting processes and finding opportunities for more automation, tuning for better results, and trying alternatives without the negative impacts of breaking or breaking fine optimized processes. Your chosen visualization might be a personal preference, but as organizations mature more sophisticated visualizations will be needed until the smart autonomous bots or agents can do this work as a partner or autonomously.