A simple way to explain Big Data to anyone
Two things happened this morning. The first was that I chose to break a long-standing rule and signed up for the New York times monthly subscription. Ugh, the hated paywall. As cordcutters, we pay for very little of our news and entertainment, Netflix aside.
Which is how the second thing happened. I paid because they enticed me with a quiz that promised to identify where an American is from by correlating the way words are pronounced and used for common things. There were questions like, “How would you address a group of two or more people?” After I answered, “you guys,” it showed that I’m in the mainstream of the U.S. with the exception of the Old South. Each question showed the usage patterns for a word or words or pronunciation on the subsequent screen.
Western New York!
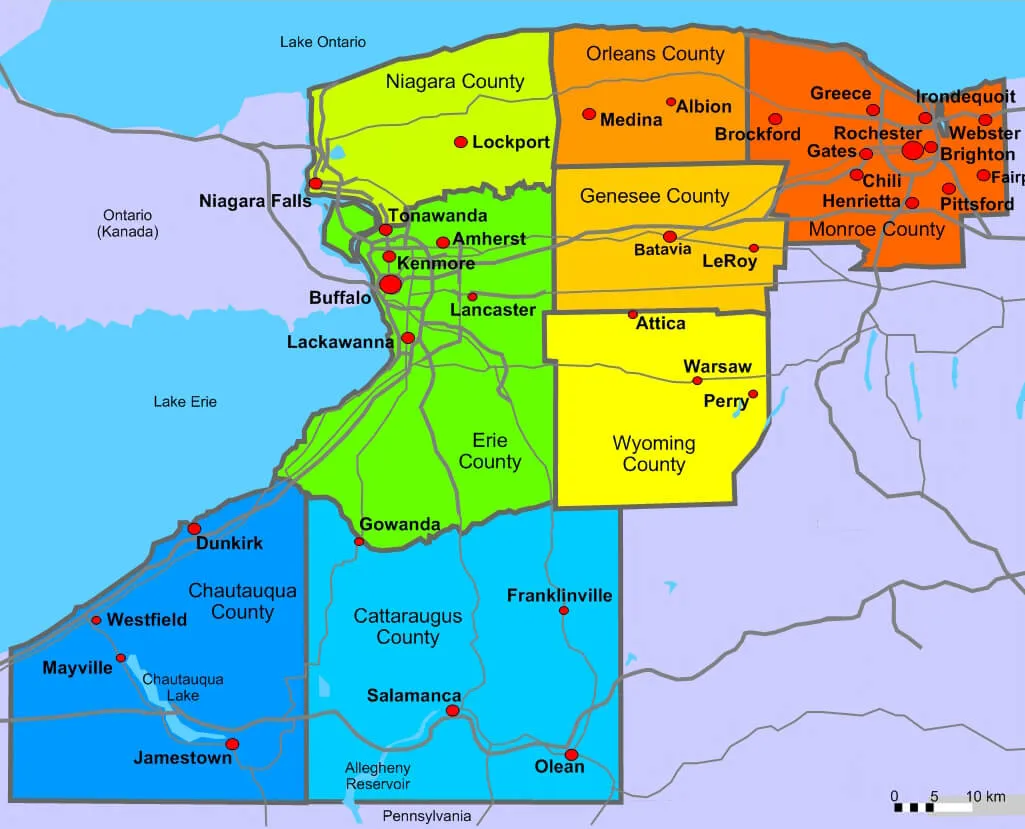
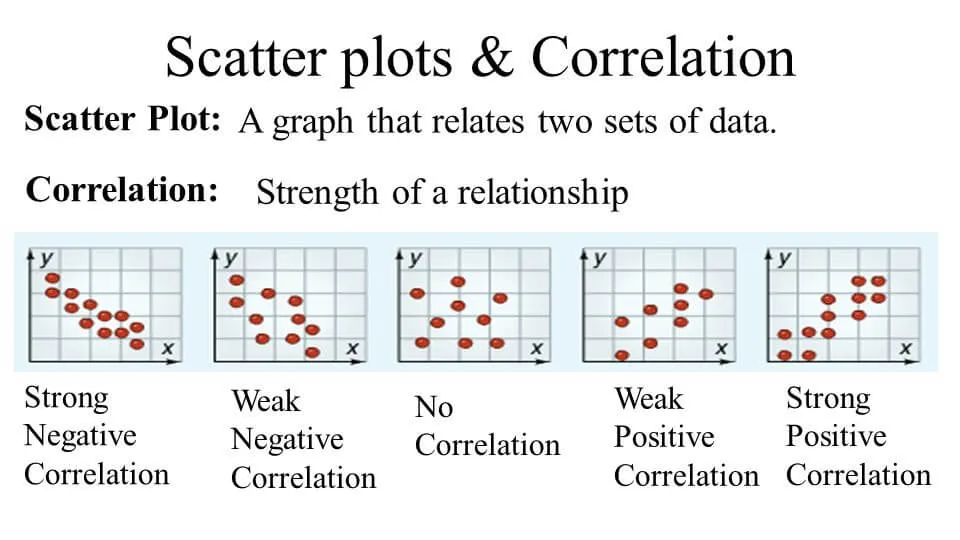
I took the test based on the words I used growing up, not the words I use today, after living in a few countries and many states. A few questions later, it said I was likely from Western New York, which was spot on (a term I would never use back home). But even better, it told me both the broad pattern based on responses to all of the questions as well as the narrow pattern, a strong correlation to one answer — the word I grew up using for athletic shoes, “sneakers.”
It was an excellent example of key principles of Big Data analytics and here’s why:
Enough data to show a pattern
The quiz was developed using 350,000 responses. That’s not an enormous data set by Big Data standards, but it represents enough data to very accurately create an outcome — in this case, where someone is from. Big Data doesn’t have to be massive to work. It only has to have enough data for useful patterns to be revealed. In this case, 350,000 variations (responses) of 25 data points (the questions) was clearly enough. Some questions require far larger data sets to show patterns, some less.
More data isn’t necessarily better
The 25 questions chosen for the quiz were culled from a larger number of questions in the original sample. These were the questions that produced the data that identified a person’s origins efficiently. More questions doesn’t create better answers because some data simply matters more, some much less. Each company exploring Big Data has to come to terms with what matters most for getting the best answer in the most appropriate time frame for taking action.
Data can be weak or strong
Not all data is created (or used) equal(ly). The fact that “sneakers” is what the NY Times called “most distinctive” for my husband’s vocabulary shows that more data doesn’t always mean better answers, as some data is simply stronger in meaning because it teases out the answer more quickly. How I answered the question about what to call a freight moving truck (I said, “semi”) likely meant less in the outcome.
Seemingly unrelated data
Quiz questions crossed the boundaries of word use, colloquialisms and pronunciation, three concepts connected to geography but not necessarily related. If we only had data and didn’t know it represented linguistic patterns from a certain country, it might appear unrelated. Big Data technology is all about working backward from unrelated and unstructured data to find patterns that produce an output. If we had no map, we could still ascertain that certain people had a similar background from patterns in their language.
Visualization is really cool
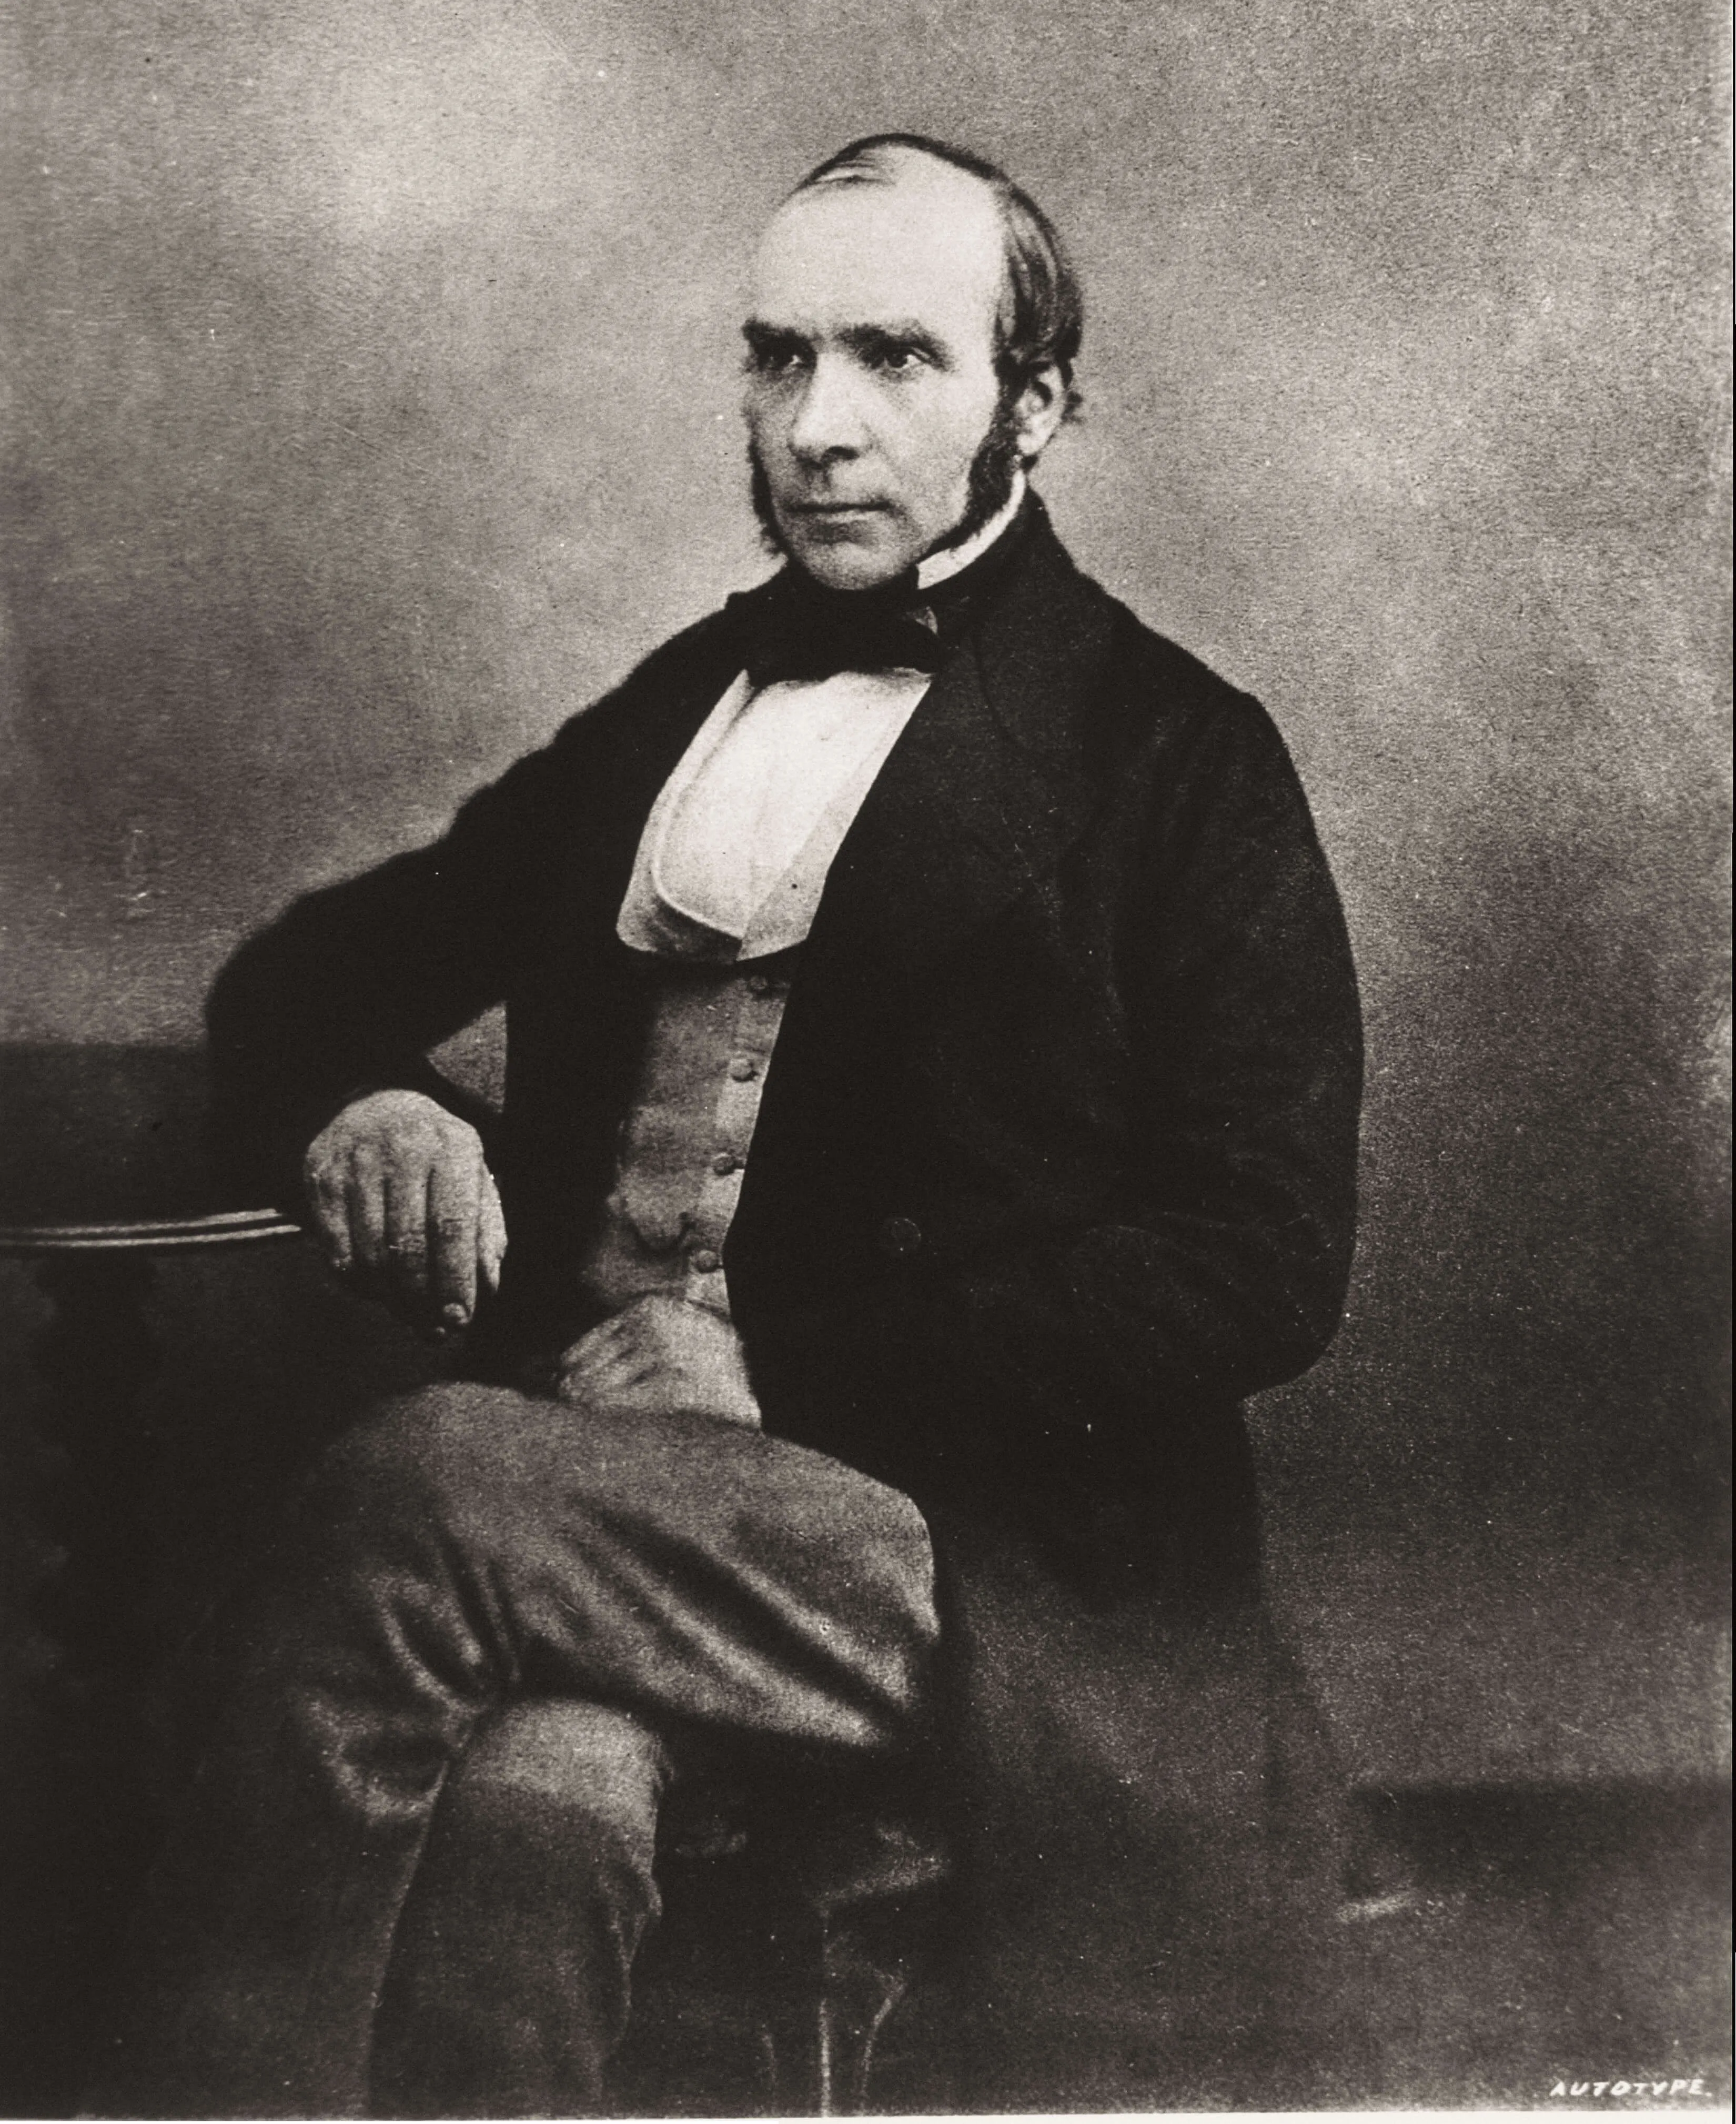
A picture truly is worth a thousand words. In a world where focused attention is in short supply, data visualization breaks through the noise. Data doesn’t have value by itself unless it has context for its meaning and use. Just as John Snow famously plotted cholera case in London to trace the disease back to contaminated water, data can have meaning that remains hidden until it shows up in visual context (in this case, geography). In our NY Times quiz, we see that linguistics has dense clusters and areas of lower correlation corresponding to American westward migration patterns (see below).
Getting back to Big Data
While this demonstrates aspects of the analytics side of Big Data, it isn’t really a Big Data example. That’s because Big Data is defined by O’Reilly analyst Edd Dumbill as, “data that exceeds the processing capacity of conventional database systems. To gain value from this data, you must choose an alternative way to process it.” (Note: Gartner analyst Doug Laney was the first to define Big Data back in 2001 referring to it as data with high volume, velocity and variety.)
Secondly, as the quiz shows, data is nuanced, and more data is potentially even more nuanced. This means it takes some combination of business experts with powerful tools, data scientists (of which there are few), and maybe machine learning applications like LIONsolver or Ayasdi. Getting your arms around Big Data is a big job.
Lastly, we can’t say for sure what data will be valuable at a future point in time or to untapped parts of the business. We don’t know what data seems silo’d today that will join up with other data tomorrow to have real context. That means we have to always keep collecting, keeping in mind that more than Big Data, the challenge is all data.
The post A simple way to explain Big Data to anyone appeared first on Success In The Workplace.