
5 Techniques to drive insights from data
Blog: NASSCOM Official Blog

“Data is the new oil.” — Clive Humby
Clive Robert Humby OBE is a British mathematician and entrepreneur in the field of data science and customer-centric business strategies. It is rightly pointed by him about data. Each & every industry/business is standing on the pillars of data. Facebook, Jio – two separate industry players yet united by Data to take on the globe. Data is driving business & making them run faster than ever.
Below are the 5 techniques used by almost all industries to drive insights from Data.
Analytics
One of the widely used tools to derive actionable insights from your data, is analytics.
Let us understand what Analytics is. It is the practice of managing, capturing & deriving meaningful insights by turning raw data into information.
For example, it is very imperative for digital marketers to understand the behavior of their target audience & from what area or region they belong in order to get more reach & impressions/views. They need to have a clear footprint of the views, clicks i.e. let’s say 50% of people who came to my website are from south India while the rest are from nearby areas. This means that the demand for what I am selling through my website is available in the south as well.
Analytics is the hottest topic ever because the world is evolving digitally, which in turn is generating data in billions. Additionally, the speed at which change is taking place in the 21st century is remarkable. As a result, businesses follows a 3 fold approach –
- Visualizing the Data
- Deriving Insights from the data
- Using that data for forecasts
Google Analytics, known in the industry as GA, is another free “service that provides statistics and basic analytical tools for search engine optimization and marketing purposes”. It has a feature that reduces the work that is required to put Google Analytics data into Google Docs, Sites or Spreadsheets.
In Google Analytics, you can choose one of the many reports that Google Creates or can even build your own customized report using the drag and drop interface.
Observation

What is implied here is nothing but a simple observation. Observations merely report what was witnessed when reviewing consumer data. It can be sales patterns over a period of time, changes in trend, use of the internet over a certain time period, and so on & so forth. Observation helps to understand human behavior in not just one particular focused aspect but rather in a wide spectrum of areas.
Observations make generalized assessments of data that apply to many people.
Here is an example of an observation technique, “Smartphone users in India on an average spend 70 minutes per day watching videos”. (Source) This is an observation.
Now, Insight from this, People in India who use smartphones are more digitally active & prefer to watch videos due to low tariff rates and easy availability of data & regional content as the case may be. Moreover, this is fueled by an aggressive pricing strategy specific to mobile data & online video & movie streaming platforms.
For digital marketers, observing other people on social media, the term is known as, “Social Listening”, is a useful observation technique that helps marketers understand their Target audience in a more vivid manner.
Past experiences (Trends/Graphs)
In continuation of analytics & observation, every insight drawn from either of the two, individually or combined, is an experience for the business. For example, in the past, it was seen that the demand of 40 inch LEDs was more than the 30inch LEDs. But the production of 30 inch LEDs was more and when the results arrived from the market, the company wrongly predicted the demand. So, it was understood that our customers were inclined more towards 30 inches than 40.
From past experiences, examine different time ranges, such as week over week, month over month, or summer over summer.
Learn to involve others, because one individual can’t see everything, invite others to delve into the data. It’s vital to have several pairs of eyes looking for actionable insights. Past experiences can also help understand consumer insights as they are typically derived by analyzing data to see consumers through a different light. It then inspires a unique business action to meet the consumer more effectively.
Lastly, the best insights often come from looking not at singular data points but at trends, especially when they change direction. So, keep looking out for the trends that change direction or a course of action for the customers.
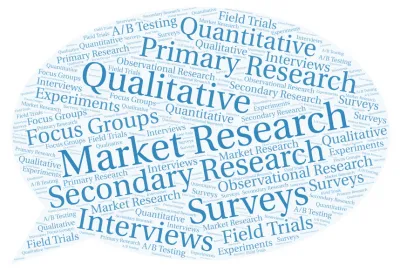
Secondary Research
The most prominent & imperative for a newcomer in the market is to derive insights from research already carried out by other individuals in the same area under consideration. From secondary research data, one can not only derive subjective insights as per the requirement but rather use the already created insights by the researcher.
This activity helps in understanding what was & what can be. It provides the opportunity to focus on the future & save time which otherwise would have been gone in collecting data single-handedly.
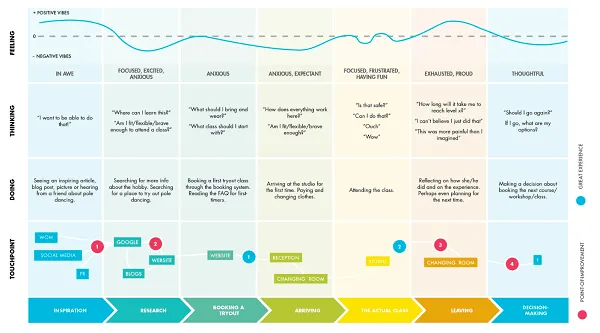
Customer Journey Maps
Using in-depth consumer data to understand who they are, what motivates them, what their priorities are in life, and what daily challenges they face will prove invaluable in unearthing the consumer insights.
Start by drafting genuine purchaser personas, pen pictures of your buyers that serve to bring your demographics to life, and to give your information some unique circumstances.
This sort of information likewise empowers you to delineate numerous buyer ventures you need to follow and each touchpoint included, seeing how your crowd cooperates with your image every step of the way.
There is the customer journey that maps the purchaser journey but there is also the day to day life of that consumer that influences this journey. It not only is imperative to use these maps to derive insights but to understand the consumers better, their behavior in certain situations & scenarios.
Below is a diagram which shows the customer journey map –
So, to say nevertheless, data is the oil that is driving the industries across the globe. Analytics, Research, observations, etc. are nothing but some important techniques to derive insights. However, keeping the COVID-19 pandemic in mind, the economy post-COVID will be something of a game-changer & these techniques, of course, will be supported by tools & technology which will give insights no one would have even imagined.
We will be coming up with more updates as techniques evolve.
Till then, Stay safe, Stay Home & Stay Healthy!
About Authors
Dr. Amit Nagpal is President, Bloggers Alliance, and also teaches Digital & Social Media at NDIM and BIMTECH.
Aayush Saxena is a Product Analyst/Customer Success executive in PinnacleWorks Infotech and is pursuing PGDM in Marketing & Business Analytics from New Delhi Insitute of Management, New Delhi.
The post 5 Techniques to drive insights from data appeared first on NASSCOM Community |The Official Community of Indian IT Industry| :))iiğ.