You CAN do Data Science in a GUI*
Blog: The Tibco Blog
Data Science is an umbrella term for the fields of data analytics, data mining, machine learning, and artificial intelligence. It aims to find insights from data. Recent trends have shown a rapid increase in the adoption of data science practices across many industries. Business specialists with domain expertise stand to gain the most by incorporating data science methods into their processes and workflows. Such specialists include but are not limited to subject matter experts, field engineers, and business leaders. These individuals have a high degree of institutional knowledge, but little or no experience with the latest developments in advanced analytics and writing code to build software.
Making the power of advanced analytics accessible to the highly skilled domain experts allows them to innovate quickly and generate profits by aligning the advancements in machine learning with the business goals of the company. This highlights the need to democratize data science. Low-code, click-and-configure GUI (Graphical User Interface) tools and platforms function as personalized statisticians for the domain experts, giving them the ability to prototype, test, and deploy advanced analytics to solve complex problems.
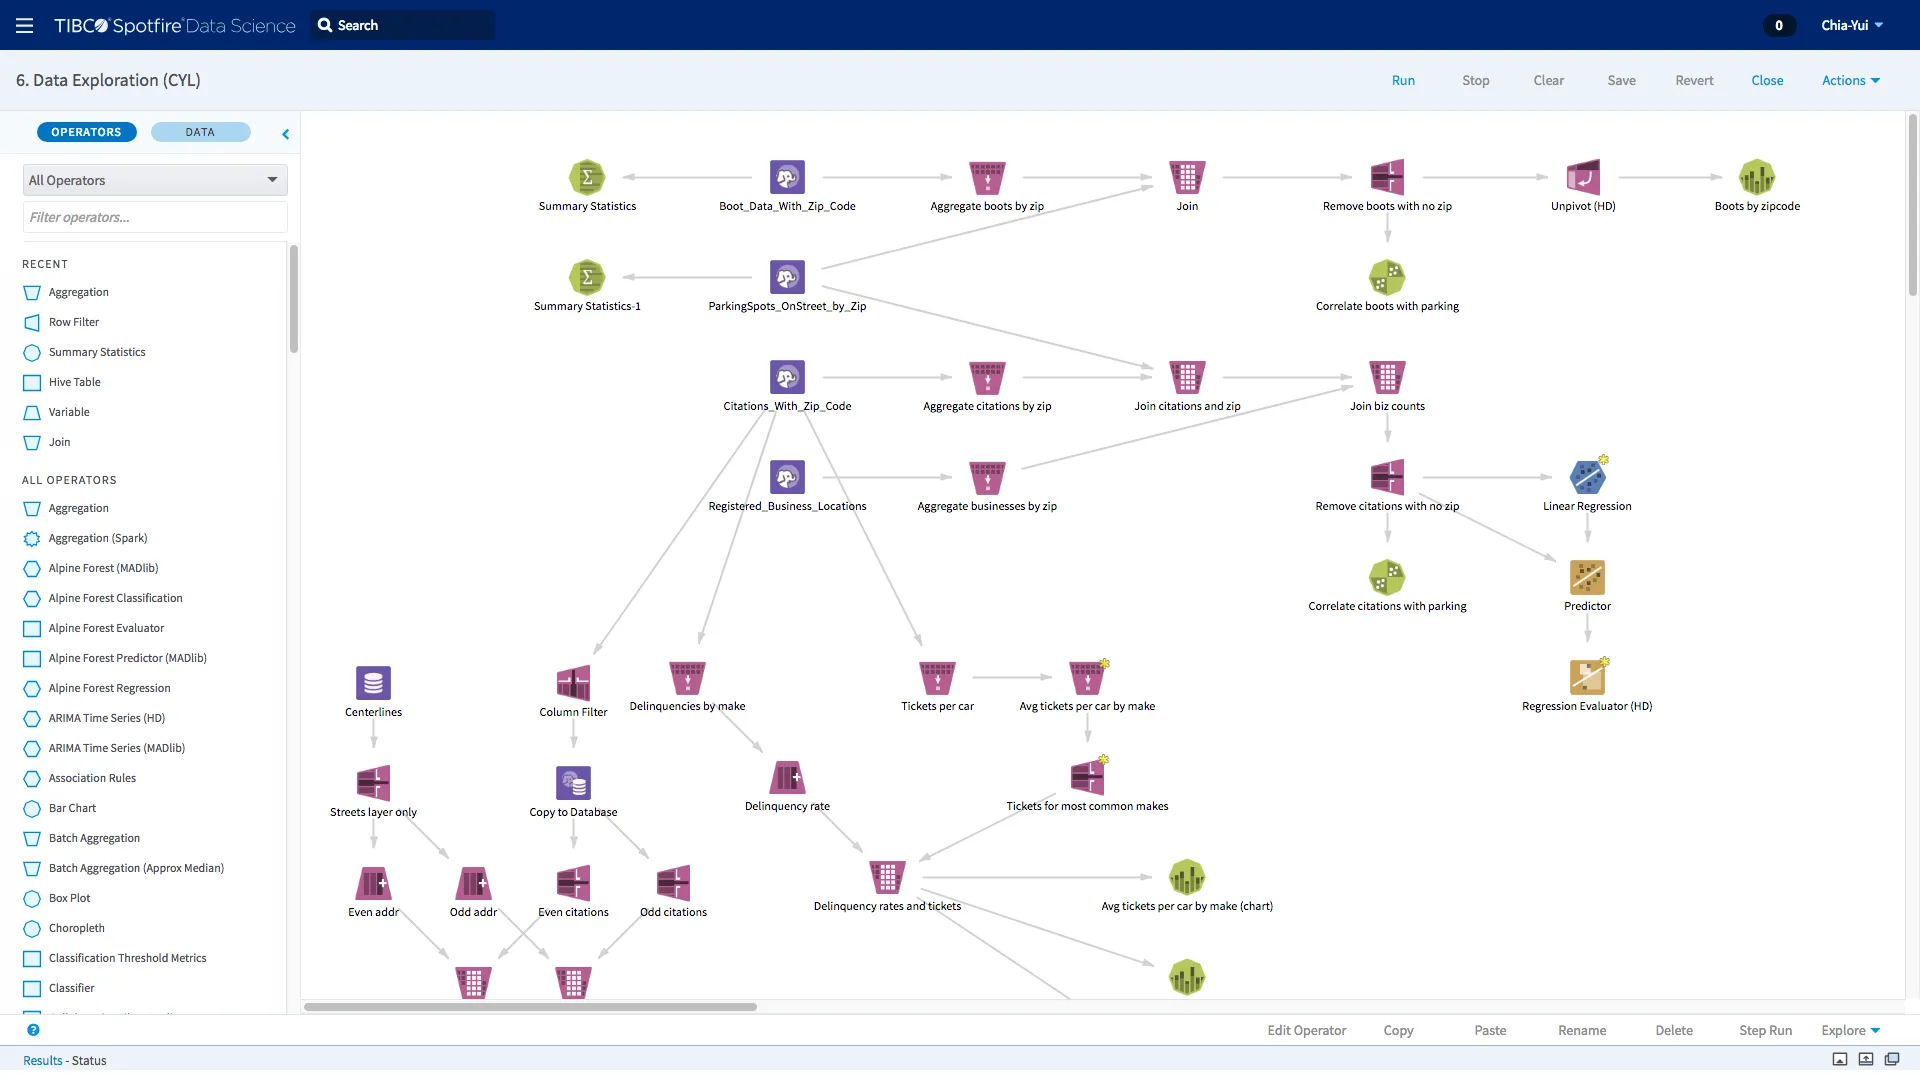
The figure shows a data exploration and analytics workflow in Spotfire Data Science
TIBCO Spotfire Data Science, Statistica, and Spotfire templates demonstrate such an architecture. Users can piece together different operators and modules to construct an intricate data science solution tailored for the problem at hand. All this through a GUI. What’s more is that these solutions visually encapsulate the entire process, making it easier for the creator and collaborators to understand and modify any part of the workflow at a later stage. Each operator or module is made available after rigorous testing by experts and provides many metrics for diagnostics and interpretation. These solutions are particularly conducive for teamwork through features that facilitate collaboration (annotations, workflow sharing, activity logs, and stateful bookmarks). For example, a subject-matter expert can build a prototype workflow, and a data scientist can refine it.
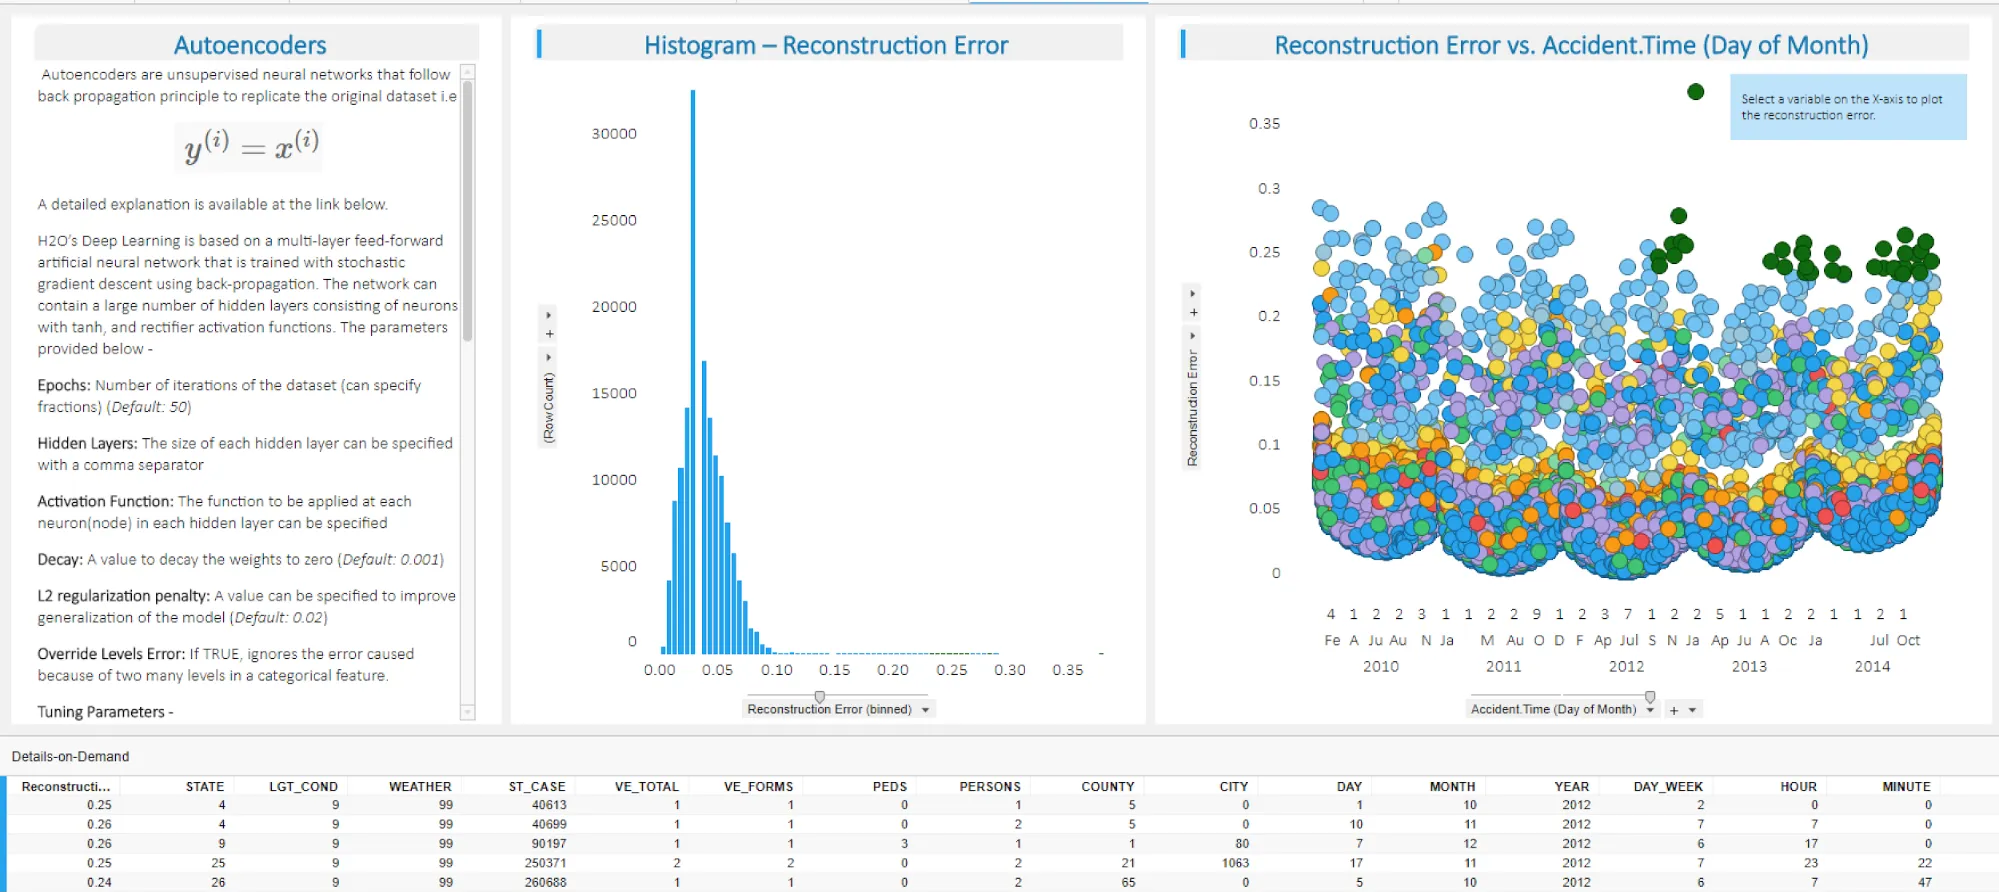
The figure shows guided template anomaly detection using deep learning available from TIBCO Community Exchange
You may wonder what happens if the specific analysis or algorithm you want to perform is not available in the software or needs customization? There’s an easy fix to this by inserting code snippets or user-defined novel operators in the workflow. The TIBCO suite of analytics solutions supports a range of modern programming languages to accommodate the desired edits within the workflow. The products also save the need for a dedicated team to handle challenges related to versioning, deployment, data access, and documentation.
So you can do data science in a GUI — when the GUI stays flexible to customizations as needed.
Learn more about TIBCO Spotfire, Spotfire Data Science, and Statistica through the community pages.