
What is ELK Stack? Complete Tutorial for Beginners
We’ll provide you with some insights into it through this blog post on the elk stack tutorial.
ELK Stack Tutorial
Elasticsearch, Logstash, and Kibana are three well-known projects that make up a stack known as the ELK stack. The ELK stack, also known as Elasticsearch, allows you to gather logs from all of your systems and applications, analyze those logs, and produce visualizations for application and infrastructure monitoring, quicker troubleshooting, security analytics, and other purposes.
However, before I get started, here is a list of the subjects I’ll be covering elk stack tutorial:
- What is ELK Stack?
- Why ELK Stack is Required?
- How to Use ELK Stack?
- ELK Architecture
- Advantages and Disadvantages of ELK Stack
- Use Case of ELK Stack
- Conclusion
Check out this insightful video on AWS Tutorial for Beginners:
What is ELK Stack?

Recently, the widely used ELK Stack was renamed, Elastic Stack. It is a potent combination of Elasticsearch, Logstash, and Kibana, three open-source tools.
In various IT contexts, these three distinct tools are most frequently used in tandem for log analysis. You can perform centralized logging with elk stack, which aids in locating issues with web servers or apps.
It enables you to browse through all the logs in one location and locate problems affecting numerous servers by comparing their logs over a predetermined period of time.
Now we should discuss the tools of ELK Stack which are as follows:
Different Tools of ELK Stack
- Logstash
Logstash is the name of the pipeline tool for data collection. The first layer of the ELK stack is where data inputs are gathered and fed into Elasticsearch.
It gathers numerous types of data from various sources all at once and makes it readily available for use in other applications.
- Elasticsearch
Elasticsearch is a NoSQL database that uses RESTful APIs and is based on the Lucene search engine. It is a distributed search and analytics engine that is very configurable.
Additionally, it offers straightforward deployment, utmost dependability, and simple management through horizontal scaling.
It offers sophisticated queries for performing in-depth analysis and centrally maintains all the data for speedy document searches.
- Kibana
Kibana is a data visualization tool. It is used to visualize Elasticsearch documents and gives developers quick access to information.
For displaying the results of sophisticated Elasticsearch queries, the Kibana dashboard offers a variety of interactive visualizations, geospatial data, timelines, and graphs.
Are you searching for the top AWS Training in your city? Join Intellipaat’s AWS Certification Course right away!
Why ELK Stack is Required?
Now the question arises why there is a need for an elk stack. To get the answer to this question you have to read further.
As we know ELK Stack is very popular because it meets a demand in the field of log analytics, the ELK Stack is well-liked.
You need a log management and analytics solution to monitor this infrastructure as well as analyze any server logs, application logs, and clickstreams as more and more of your IT infrastructure migrates to public clouds.
For a fraction of the cost, the ELK stack offers your developers and DevOps engineers a straightforward yet reliable log analysis solution to help with failure diagnosis, application performance, and infrastructure monitoring.
You have the option of managing an open-source alternative to the ELK stack with OpenSearch, OpenSearch Dashboards, and Logstash, or you can deploy and manage the ELK stack yourself using Apache. Hence this is the reason why there is a need for ELK Stack.
How to Use ELK Stack?
We know that ELK Stack is widely used for log analysis. As I previously stated, the various parts of the ELK Stack when combined offer a straightforward yet effective solution for log management and analytics.
The various parts of the ELK Stack were created to work together harmoniously and without a lot of additional configuration.
However, depending on your environment and use case, you may wind up constructing the stack very differently.
However, more components will likely be added to your logging architecture for resiliency (Kafka, RabbitMQ, Redis), security (Nginx), and managing increasingly complicated pipelines designed for processing massive amounts of data in production.
Numerous Elasticsearch nodes, possibly even multiple Logstash instances, an alerting plugin, and an archiving method are all components of a full-production grade architecture.
Because of this, you should be certain of your use case before configuring your stack.
This will have an impact on many different things, including where and how you install the stack, how you set up your Elasticsearch cluster, how you distribute resources and many others.
Interested in learning more? Go through this AWS Tutorial!
Career Transition


ELK Architecture
The design of the ELK stack, which illustrates the correct log flow within ELK, is as follows. Here, Logstash gathers and processes the logs created from multiple sources in accordance with the given filter parameters.
ELK Stack Installation
STEP 1: Go to https://www.elastic.co/downloads.
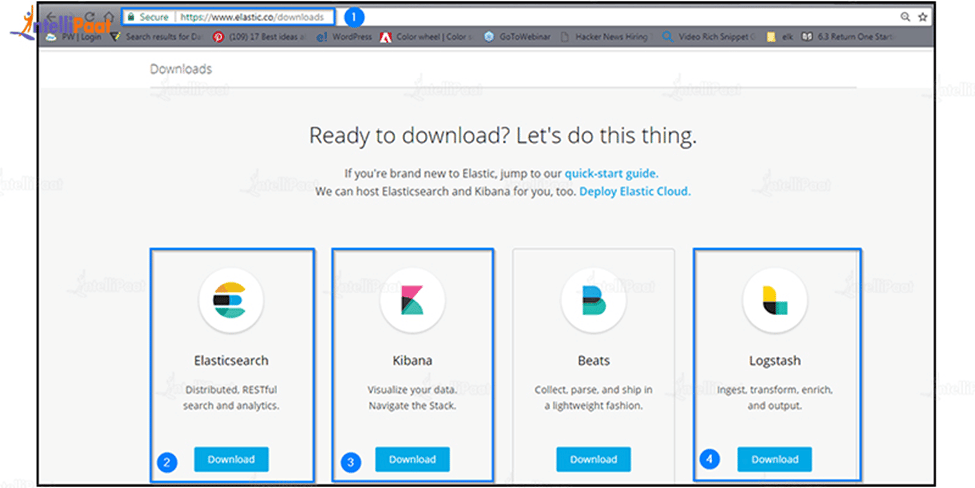
Step 2: Choose and download Elasticsearch
Step 3: Choose and download Kibana
Step 4: SELECT and DOWNLOAD Logstash
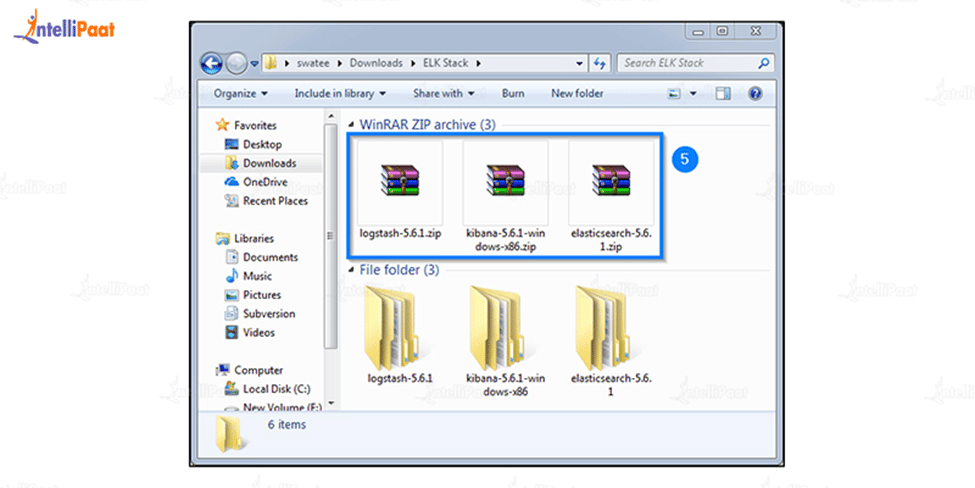
Step 5: Unzip all three files to obtain their folder files
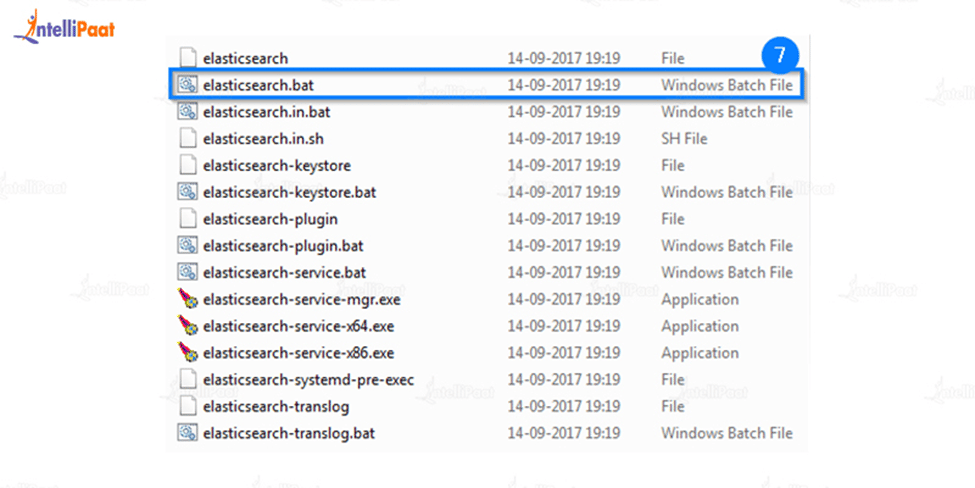
Step 6: Go to the bin folder in the elasticsearch folder after opening it.
Step 7: To launch the elasticsearch server, double-click the elasticsearch.bat file.
Step 8: Await the startup of the elasticsearch server.
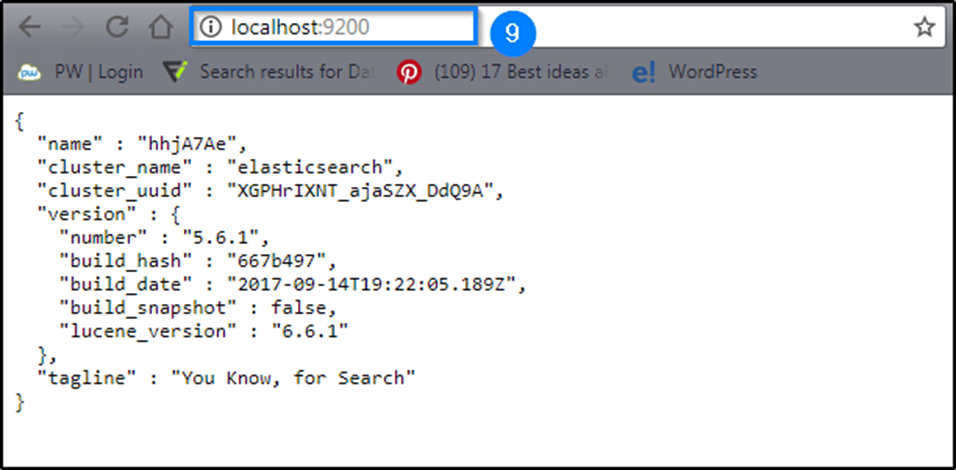
Step 9: Enter localhost:9200 in the browser to see if the server has started or not.
Installing Kibana
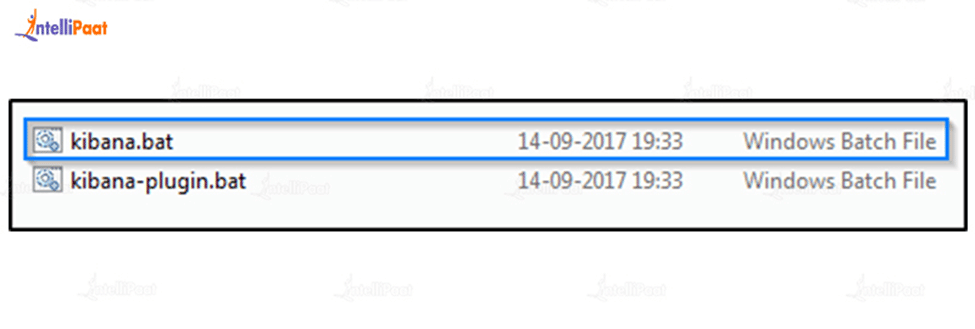
Step 10: Go to the bin folder in the kibana folder by opening it now.
Step 11: Kibana.bat must be double-clicked in order to launch the elasticsearch server.
Step 12: Attend the kibana server starting.
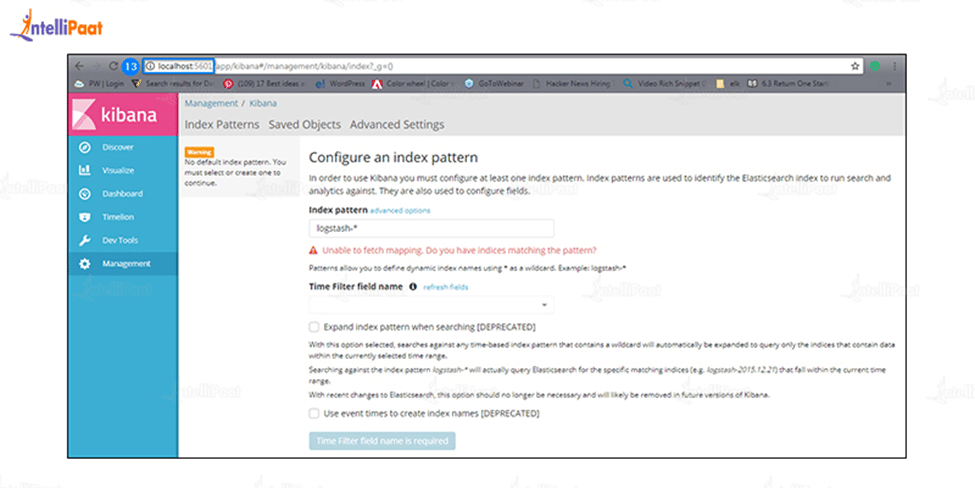
Step 13: Go to the browser and enter localhost:5601 to see if the server has started or not.
Installing logstash
Step 14: Now access the logstash directory.
Step 15: Open the command prompt and navigate to your logstash folder to test your installation. Next, type:
| 1 | binlogstash -e ‘input { stdin { } } output { stdout {} }’ |
Step 16: Keep waiting until the command prompt displays “Pipeline main started.”
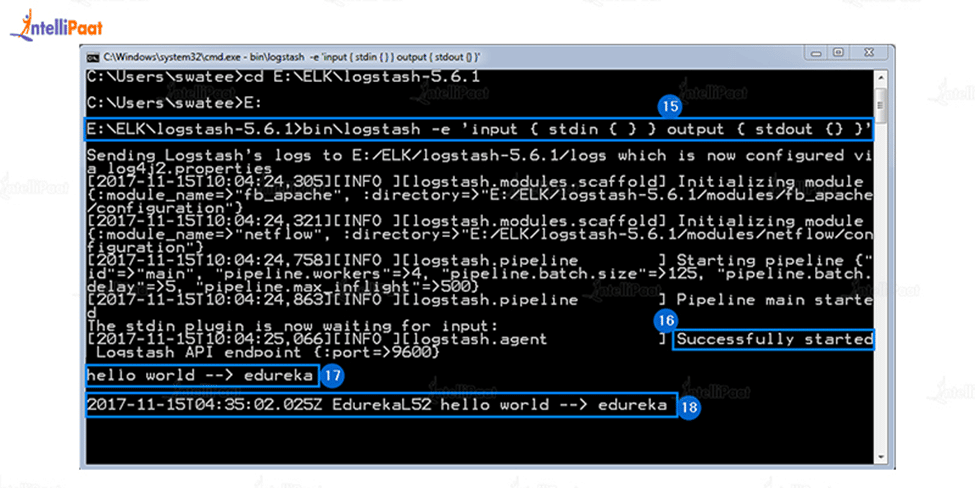
Step 17: At the command prompt, type a message and press Enter.
Step 18: The message is given a timestamp and an IP address by Logstash, which also shows the information on the command line.
Go through this blog on power AWS Interview Question to crack the next job interview!
Advantages and Disadvantages of ELK Stack
Let’s discuss the advantages and disadvantages of ELK Stack in this elk tutorial.
Advantages
- Starting is Free
The ELK stack’s inexpensive entry cost is one of the main factors contributing to its increasing popularity. All of the ELK software components are open-source and free, so no initial purchases or ongoing software licensing costs are necessary.
- Numerous Hosting Choices
Organizations can pick from a variety of hosting alternatives when establishing an ELK stack. A local server can be used to deploy and operate an ELK stack for enterprises with the necessary skills and resources.
- Integrated Logging Resources
The ELK stack’s centralized logging capabilities, which enable users to compile logs from increasingly complicated cloud settings into a single searchable index, are among its most crucial characteristics.
- Real-Time Data Visualization & Analysis
Users of the ELK stack can use Kibana to construct custom dashboards and visualize data using Elasticsearch real-time data. Reduced time to insights thanks to real-time data visualization.
Disadvantages
- Demands for Complex Management
The ELK stack is available for free download and thousands of people download it each month, however, getting the software is only the simple part.
The stack deployment is a multi-step procedure that is complex.
- High Ownership Costs
Although the ELK stack software is free to use, infrastructure and resources are needed to construct, expand, and maintain the ELK stack.
It is obvious that “open-source” doesn’t always equate to “cheap” after taking into account all of these expenses.
- Issues With Stability & Uptime
Elasticsearch indices are a crucial factor in the volatility of the ELK stack. Elasticsearch can query or analyze documents with log data that are part of an index.
- Scaling Problems
The instability of big indices, the poor cost economics of sharing and replication, and the quick spike in TCO that manifests when organizations raise their daily ingestion of log files are just a few of the problems that contribute to the scaling challenges of the ELK stack.
Use Case of ELK Stack
- Creation and Problem-solving
Although log management is excellent for troubleshooting and monitoring performance, it may also be used early in the lifespan of an application, during the development stage.
- Application Performance Monitoring
Although log management is excellent for troubleshooting and monitoring performance, it may also be used early in the lifespan of an application, during the development stage.
One of the well-known companies that use ELK to track performance is LinkedIn. To support their load in real-time, they also implemented Kafka.
- Integrity and Security
Companies are being compelled to comply with an expanding number of compliance standards, such as HIPAA, FISMA, SOC, or PCI, as a result of the rise in cyberattacks. They must therefore have a trustworthy security system in place.
- Business Intelligence
BI is the process of using tools, software, apps, technologies, and best practices to turn raw data into insights that may be used to improve performance and cooperation as well as data-driven business decisions.
Courses you may like
Conclusion
This blog post on the elk tutorial is now complete. You are now prepared to use Logstash, Elasticsearch, and Kibana to conduct numerous searches and analyses on any data you desire. As, we tried to explain what is elk, its features, and its working. We also explained the pros and cons of elk and the real-life application of elk stack. I hope this blog tried to provide a clear understanding of ELK Stack and is beneficial to you to kickstart your career in this field.
For more information on What is ELK Stack?, visit our AWS Community
The post What is ELK Stack? Complete Tutorial for Beginners appeared first on Intellipaat Blog.
Blog: Intellipaat - Blog
Leave a Comment
You must be logged in to post a comment.