
Visualize 5 Cool Insights on Holiday Tree Trends Over Time
Blog: The Tibco Blog
Did you know Thomas Edison’s assistants proposed putting electric lights on Christmas trees? There’s a long and rich history surrounding holiday trees, in America and around the world. According to the History Channel, symbolic traditions involving evergreen trees in winter began in ancient Egypt and Rome and continue to take on new meaning today.
New Holiday Traditions: Annual Analytics
Here at TIBCO, we’ve started our own holiday tradition involving the classic festive trees: using our data visualization software to understand trends in holiday tree data. Last year, we shared our analysis and “treemap” visualization (quite literally a treemap of trees) via TIBCO Spotfire®. This year, we dived even deeper into the data, using the new Spotfire Mods functionality to design custom apps for greater interactivity. Here’s what we found:
- Top Tree Producing States: All 50 states contribute to the holiday tree industry, but our analysis shows the greatest production occurs in Oregon, North Carolina, Michigan, and Pennsylvania. Also interesting is that while Oregon and North Carolina are top producers overall, states like Ohio and Michigan definitely over-index for total tree producing counties as a percentage of their total land area.

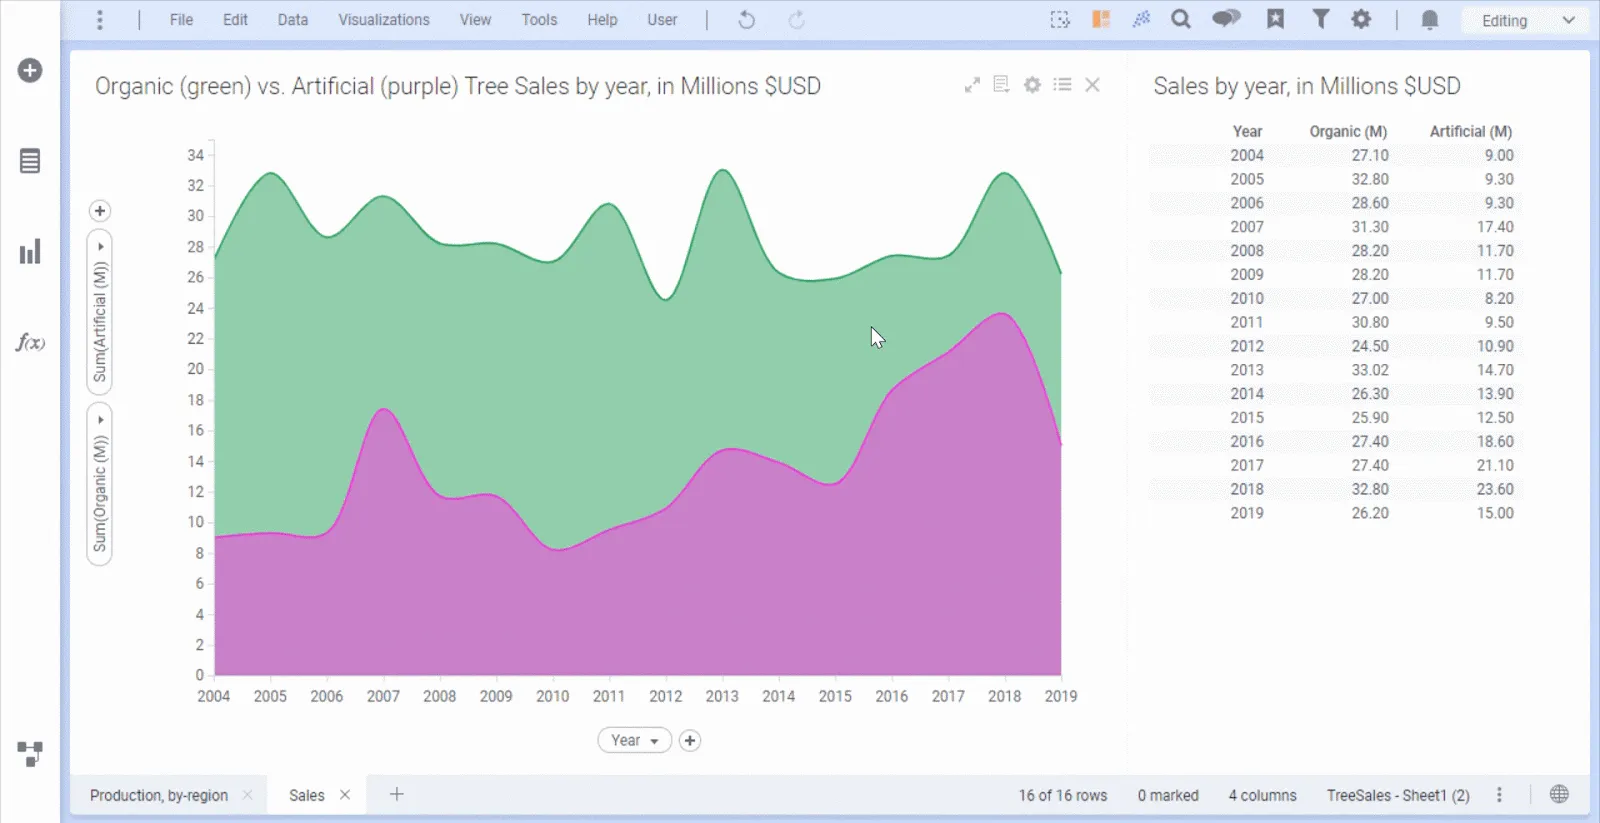
- Artificial vs. Real Tree Sales: As you can see below, artificial tree sales have been on the rise over the last decade, with 162 percent growth between 2004 and 2018. Artificial trees are taking over. Actually, 81 percent of the trees on display, whether in storefronts, businesses, or homes, in 2019 were of the artificial variety. But what does that mean for the global economy when China produces 80 percent of artificial trees worldwide and given that artificial trees cannot be recycled like real trees?
- Rising Average Price of Real Trees: According to an article in the Hustle, “During the recession in 2008, ailing farmers planted too few trees. As a result, prices have been much higher since 2016.” The article also cites the National Christmas Tree Association as stating that the average retail price for a real tree in 2019 was $75. Obviously, this is a huge market, but one that continues to shift with economic and social changes—which makes us wonder just how different our analysis next year will look.
- Consumer Demand Lower in 2019: In the area chart visualization above, we see that sales for natural trees still account for a larger share of the market. However, the artificial tree category set new high marks for sales in each year progressively from 2016 to 2018. Why could this be? One hypothesis might be that as Baby Boomers retire as “empty-nesters” and downsize their homes, they are buying fewer trees, but let us know your thoughts on this surprising find.
- The More the Merrier? Multiple Trees: According to a survey by the American Christmas Tree Association, the number of households in the United States that display more than one Christmas tree has grown by 10 percent from 2014 to 2019. In 2019, approximately 16 percent of American households display multiple trees. But will this trend continue or, as with the overall tree sales, will the number of trees per household decrease in the coming years?
We’ve started our own holiday tradition involving the classic festive trees: using our data visualization software to understand trends in holiday tree data.
Click To Tweet
A New Tradition: Immersive Yourself in Custom Analytics Applications
But this is just one festive story you could tell around data trends. What about shopping trends this year, will there be an increase in small business online sales? What will be the top gifted items in 2020?
You tell us! Join our tradition, and read our whitepaper to learn how the immersive qualities of Hyperconverged Analytics will create new value for your business. For a closer look at all of “What’s New in Spotfire®” including visualization Mods, watch our 20-minute intro webinar on demand.