Using SCORE to reframe the business-model
Blog: Tom Graves / Tetradian
He turned up with a copy of the Business Model Canvas template, printed on a large table-sized sheet of paper. “But where do we start?” he said.
Good question…
A bit of background first. I am, as usual, still rethinking my own business-model, with the recent Australia ‘EA Tour’ indicating once again that I need to reach out to a more strategy-oriented market than just mainstream ‘enterprise’-architecture. I’d been talking about this with my nephew Joseph Chittenden – a very talented artist, concept-designer and 3D modeller – and he suggested we work together on this: use my tools to help him look at his own business-model, because he was going through much the same kind of soul-searching reassessment as I was. The idea was that by using my tools on a non-IT-oriented small-business model, I would likely also get some good ‘customer-insights’ about the tools, and about my own business-model too.
Deal!
So what happened next? Read on…
He had his big blank Business Model Canvas in hand, but he felt a bit doubtful and dispirited about it. He’d tried it before, he said, but it had just gotten him nowhere. Stuck.
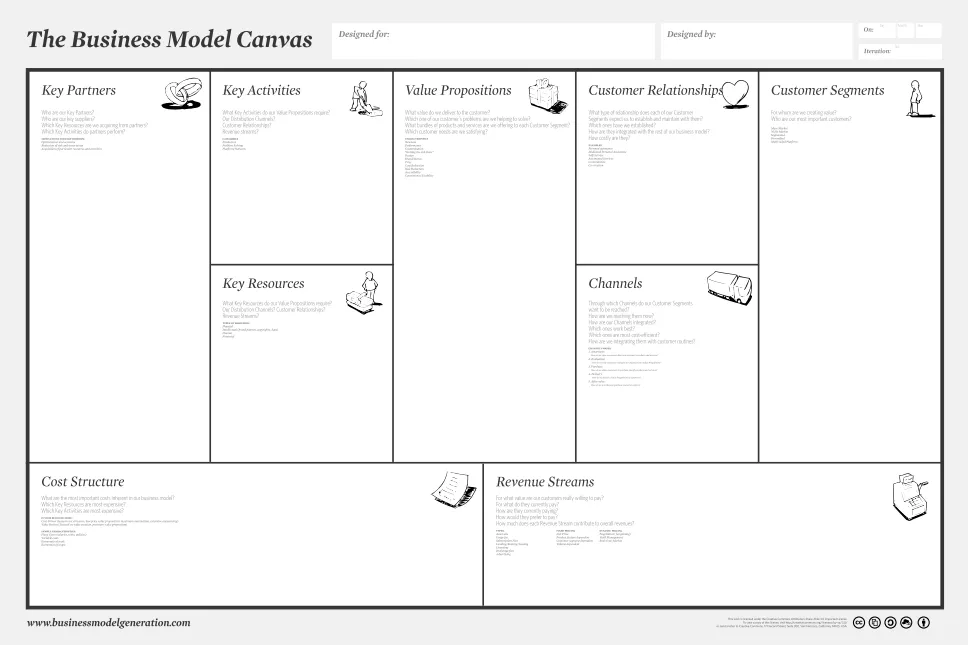
Was there an alternative way to do this? My first thought was to try Enterprise Canvas instead:
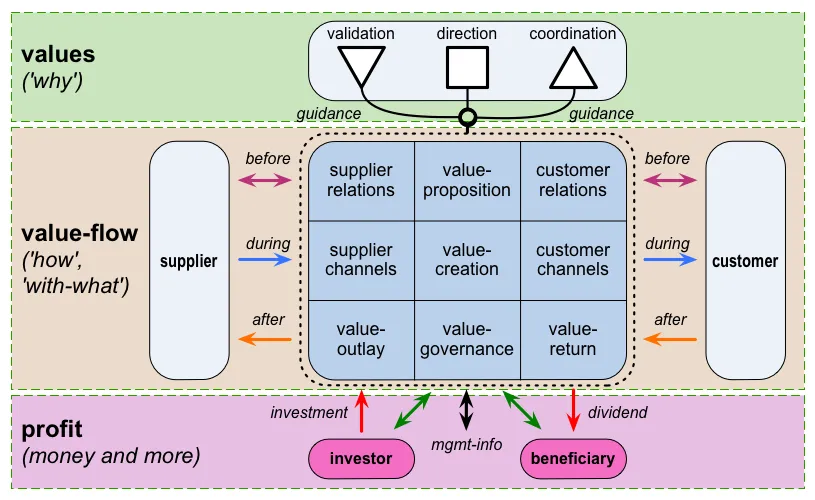
But even as I reached out for the laminated-sheet of that diagram in my toolset-folder, I realised it was the wrong approach. It’s probably what most people need, for proper business-modelling – but if BMCanvas was too daunting already, then this might well only make things worse. Hmm… – tricky…
What else? What might help, not as a substitute for BMCanvas, but to come before it? Something that would help make sense of what’s going on in that business-context, and provide a solid groundwork on which to build towards a business-model?
My usual first choice to start on sensemaking would be SCAN, or perhaps one of the SCAN crossmaps:
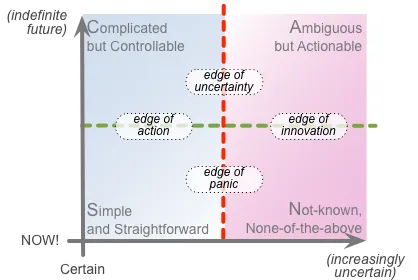
Again, though, it didn’t seem the right choice for this need. Not at all, in fact.
Which brought me to SCORE – Strengths, Challenges, Options, Responses, Effectiveness. Which, if you don’t know it already, is a kind of ‘SWOT on steroids’, or ‘SWOT for strategists’.
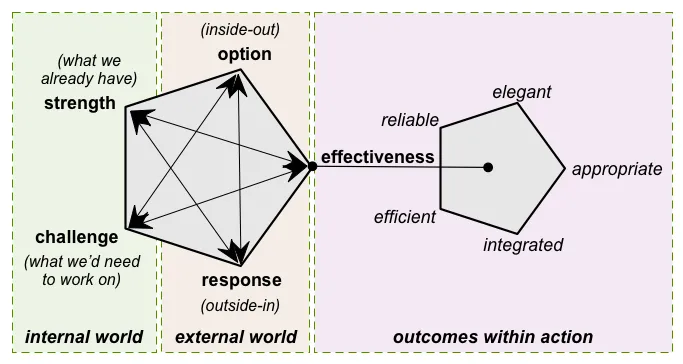
And which, yes, did seem the right choice of tool for this. Or a good enough place to start, anyway.
Which it was. (Mostly. We’ll come back to that ‘mostly’ later.) And which we did – did start, that is.
No point in going into the full blow-by-blow details, I think? Instead, suffice to say that the usual start-point for SCORE is either in Strengths – the capabilities we already have – or in Options – what opportunities can we see for new or extended markets. (Joseph was at first having trouble with the Options part, so we started with Strengths.) Once we have a suitable start-point, we then bounce around the diagram, each new item at one point triggering off implications and rethinks at the other points – a kind of iterative, interactive ripple-effect, kinda like a cross between SWOT and an active Excel spreadsheet.
(If you want more detail on the SCORE process, see the post ‘Checking the SCORE‘. The key point is that we end up with a list of value-proposition options and capabilities and other items that can be dropped straight into the respective sections on Business Model Canvas.)
By the end of the process – which took about two hours overall, bouncing back and forth, exploring new ideas and insights at each step – Joseph had done a fundamental rethink of his actual skills, capabilities, options and choices, leading to an equally fundamental overhaul of his entire business and business-model. Quite impressive, really.
At that point, we stopped, and did a kind of review of what had worked, what hadn’t worked so well, and what had happened for him during the process. The text in quotes below is from Joseph’s comments in that review:
“I’ve done SWOT on this before, and it just didn’t do anything. It wasn’t like this. You guide, but don’t force your opinions. It’s kind of showing a path – a pathfinder.
“SWOT is just bits. SCORE is a path, connected. It’s more adaptable – SWOT can’t adapt, whereas you do.
“I’m now re-evaluating everything I’ve done, in terms of what you’d said. Stuff I’d thought was of no value turns out to be the opposite – things like research.”
That last comment came up when we were talking about what kind of projects he most enjoyed. Those were the ones where he’d had the option to do some deep exploration and research, such as a map of the local town centre that he’d been commissioned to do, going down through the layers of 2000 years of history. And that project had led to another, unsolicited, doing a similar layered-history map about the centre of Washington DC.
This was fairly typical: research-oriented projects had led to other work of that kind, often out of the blue. Yet for some years he’d been pushing to do mainstream graphic-visualisation, which he struggled to get because of so much competition, and which he didn’t particularly enjoy doing anyway, but believed that it was what the market wanted. At this point he started to realise that those skills in research were not only quite unusual in his trade, but perhaps what the market actually wanted from him – indicating hints of a possible near-unique market-niche.
The other insight was around the way he does graphic-textures. Most people in the trade, and most modelling-tools, aim to support high-gloss, high-sheen, high-reflectance – a sense of ‘shiny-new perfection’. He’d thought that this was what the market wanted from everyone. Yet what he most enjoyed was creating textures that showed real-world mud and grime, or just a sense of being ‘lived-in’ – and assumed that no-one wanted this, so much so that he hadn’t bother to show any of this on his own website. But then he told me about how one ‘lived-in’ image on another portfolio-site had garnered several hundred hits and many ‘Likes’, whereas a more conventionally-’polished’ rework had barely gained any attention at all. I pointed out that this was a really clear example of an A/B test, and perhaps he ought to take notice of what his market actually wanted from him! As can be seen in his comment above, it was quite a revelation…
“When I did it before, SWOT would just be like looking in a mirror – I don’t learn anything, I just see what I already knew.
“When we started, I wanted a [predefined] framework, but this has given me far more, helped me to think – a conversation-starter. It’s a lot more exciting, to be honest.”
When’s the last time you heard a SWOT exercise described as ‘exciting’? There’s definitely something different that happens with the iterative, exploratory process that happens with SCORE.
“[Each previous attempt at working with] BMCanvas was the same as with SWOT – it just gave me what I fed into it, it didn’t do any thinking like happened with you. BMCanvas is pointless without this [SCORE exercise]. [SCORE] is still quite abstract, but it’s critical to have it.
“I remember someone said that ‘Any direction is a wrong one if you don’t know where you’re going’. I’d been going round in circles – I’d thought I had a plan, but obviously I didn’t.”
A couple of times he came back to the point that this wasn’t just about the SCORE diagram itself, but that iterative process, and my own role as a facilitator: “you’re acting as a guide”, he said.
“When I started this today, I wanted boxes to fill out, and I wanted it nice and neat, with explanations. [Which you did, but] you showed me other things as well, like that Key Person of Influence thing. You know what to do, to help.”
Two of the other frameworks I’d brought into the discussion had been Richard Nelson Bolles’ What Color Is Your Parachute?, with its well-known ‘flower-diagram’; and Daniel Priestley’s Key Person of Influence, with its concept of pitching for a ‘micro-niche’. As Joseph indicated in his comment above, the latter had made a lot of sense, particularly for his own specific type of context and needs.
“You guided me through the stages – asking me, not telling me. You showed me an area that I was vaguely aware [of], but hadn’t thought was important – but turned out to be the most money-earning.”
That’s a reprise on that point above about the focus on research, and the ‘lived-in-ness’ texture. The comment about ‘most money-earning’ relates to the key-phrase ‘Earning income doing work I like’, which we’d placed as the central concern for the SCORE session. More about that later.
“What was useful was you set off sparks of thought that got me connecting the dots, like that YouTube thing.”
That was about filming the progression from first rough sketches to finished visualisation: as indicated by that ‘A/B test’ mentioned earlier, he realised that there would be a fair bit of interest in a ‘how-to’ on that aspect of his work – and potential income from just that, too.
“It’s like you’re not giving me a finished Lego model, you’re giving me the Lego blocks and helping me find my own model. You didn’t force it on me.”
In other words, avoiding the classic traps of ‘solutioneering’, or ‘vendor-driven architecture’. He comes at the same point from a slightly different direction, using another Lego metaphor:
“It’s like I thought I wanted a Lego car, from the printed instructions in the box, but talking with you, I realised what I really wanted was to build a Lego ship. But I didn’t know when I began that what I’d wanted was to build that ship – and that I could do it.”
At this point he came back to the blank BMCanvas template that he’d brought with him at the start of the session.
“I’d put off doing BMCanvas, but now I’ve got this, I can now do BMCanvas as the next stage. Before, it would have been pointless because I didn’t understand it. With what we’ve done on the SCORE, I’ve now got something to put into the BMCanvas.”
Somewhat as with SWOT, but arrived at via more depth, the outcome of SCORE is a set of item-lists. The respective items are typically transferred to BMCanvas as follows:
- Strengths and Challenges: these become existing or needed capabilities for BMCanvas sections Key-Activities and Key-Partners, and assets and resources for Key-Resources and Key-Partners
- Options, as cross-checked by Responses and/or Effectiveness: these are expressed as BMCanvas Value-Propositions for Customer-Segments
- Responses: as ‘Rewards’, these provide content for BMCanvas Revenue-Streams; otherwise often as content for Cost-Model
Note that SCORE’s focus on Effectiveness helps to identify hidden costs that would otherwise make a business-model seem more attractive than it actually would be in real-world practice.
(In part because of the previous practice SCORE, he was able to work with BMCanvas in a much more iterative way, too, with much more emphasis on the relationships and links between the BMCanvas ‘domains’, as well as the content for the domains themselves. Some interesting innovations arose, too, such as the importance of also mapping ‘anti-Value-Propositions’, items that people might want but that we don’t want to do. More on that in another post soon, if anyone-s interested?)
A key end-point of this exploration was that Joseph was able to identify a very different value-proposition – more valuable from his perspective as much as for prospective clients – that that with which he’d started.
“On the BMCanvas Value-Proposition, I can see I was struggling to do stuff I didn’t even like doing – but this is different! I’d sent out emails to people on what I assumed they wanted, rather than [what I wanted to do]. I didn’t want to do what I thought they wanted, and they didn’t even want it anyway.
“I had seen that pattern before, of that doing what I wanted to do had lead to other work, but I hadn’t really spotted it. And the bit that’s most interesting to me – bringing lived-in-ness to a drawing – is not really in BMCanvas. I wouldn’t have found it that way, because it was like with SWOT, like looking in a mirror, all I would see was what I brought to it. But this is so different, it’s like you’ve taken the blinkers off me, or something.”
For Joseph, one of the first outcomes from that SCORE session was this:
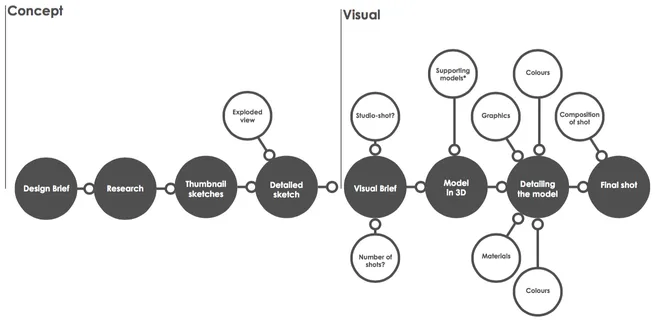
It’s a visual summary of his revised business-process, aimed at two distinct yet often related customer-segments that sometimes combine: people who just want concept-sketches, people who just want full visuals, and those who want all of it, from end to end. It’ll be interesting to watch how his website starts to change too, at JC3DVIS: Watch That Space, perhaps?
What we’d established in this session, though, was this:
- Prior to using Business Model Canvas, there’s a necessary precursor phase to identify the context for the business-model; the capabilities that can make or break its feasibility and viability, and the choices that identify whether it is or is not worthwhile.
- Although SWOT can be used for this purpose, it has tendency to fall back to a crass ‘tick-the-box’ exercise of limited real value (“looking in the mirror”, as Joseph put it); by comparison, the SCORE frame and iterative process are likely to provide much more value for this purpose.
- Even in itself, the SCORE frame provides an active visual-checklist to support the required exploratory process; but the process can be much powerful when guided by an experienced facilitator.
All in all, a lot of value from a short two-hour session!
One last point arose from a discussion that started with this earlier critique-comment by Joseph:
“I don’t understand the Effectiveness bit [in SCORE] – it’s given too much prominence relative to all the others.”
He’s right: in that SCORE diagram that we’d used, Effectiveness is separated-out, compared to the other dimensions, and a lot of emphasis placed on its five sub-dimensions.

Some previous users had complained about being confused about that layout, too: why those specific sub-dimensions (Efficient, Reliable, Elegant, Appropriate, Integrated), and not others? I’d often had to explain that they’re just generic placeholders for all of the various qualitative-factors in a context, a default set of sub-dimensions that happen to align with some of the other work on the Five Elements sets of tools – but that standard SCORE diagram is still confusing. In other words, the overall idea works well, but the layout is in urgent need of a rethink.
I’d done a couple of previous attempts at a clean-up, as can be seen in the posts ‘Simplifying SCORE‘, ‘More on simplifying SCORE‘ and ‘Simplifying SCORE, again‘ – but even the best of them didn’t work out all that well:
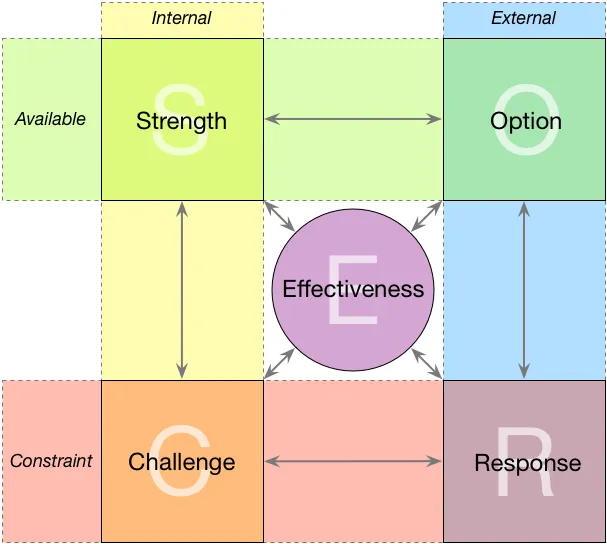
Yet with Joseph’s help – perhaps particularly in reminding me that the central concern or ‘core question’ for the SCORE session needs to be shown, and with a lot more overt prominence – we came up with yet another revised layout for SCORE that looks like this:
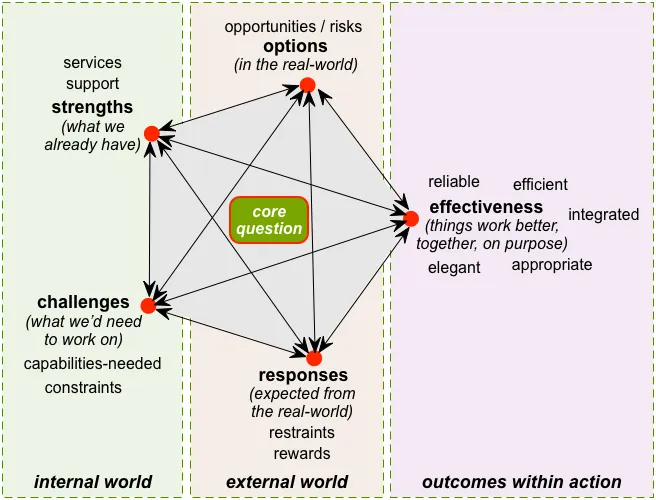
This layout gives a much strong sense of the iterative ‘bouncing-around’ that happens throughout a SCORE session. Unlike the previous designs, it highlights the core-question that needs to be held in focus throughout the session, and to which we need to return often, to keep us on-track – and to not wander off down interesting side-alleys! And it also balances out each of the dimensions, showing in italics a one-line summary of the main focus of each dimension, and listing typical sub-dimensions for each in somewhat smaller type. Try it out, perhaps, and let me know how it works for you?
Over to you for comments, anyway, as usual.