
Usage Profiles for System Requirements in the Context of Philips MR

This is a guest article by Carmen Bratosin from TNO. If you have a guest article or process mining case study that you would like to share as well, please contact us via anne@fluxicon.com.
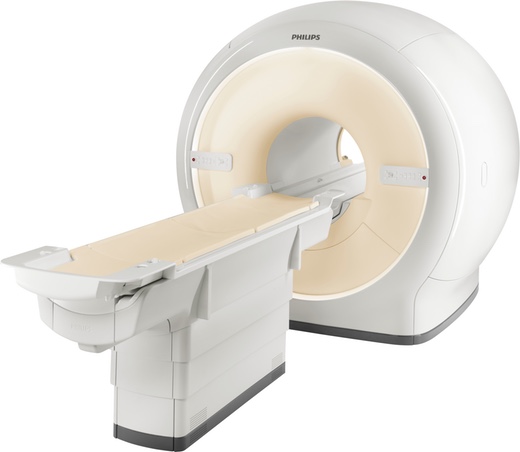
Understanding how the customer uses the system, and how its behavior deviates from the expected (and designed) behavior, is the main question that Philips MR wanted to answer by usage profiling. Philips MR is a division of Philips Healthcare that builds systems for magnetic resonance imaging (MRI). MRI is a non-invasive diagnostic imaging method.
MR systems (see above) are heavily parametrized. This means that scan parameters like position, orientation, etc. can have different values configured for different applications. Furthermore, new methods appear constantly and guidelines for the usage of the MRI with respect to a particular diagnostic are vague most of the time.
Therefore, usage profiling for an MR system starts with answering how one can define usage. To be able to define system usage in a way that it can be understood by the application specialists, we needed to overcome two main challenges:
-
The low-level scan parameters had to be translated into meaningful activities.
-
The ability of process mining to look at sequences of these activities was crucial to analyze the usage profiles in the context of the medical guidelines.
Data Abstraction
The MR system records very detailed information about which functions are used on the device and when. From a process mining perspective, the case ID is the so-called exam ID corresponding to a patient examination. The timestamps that are needed for process mining are also there. However, for the activity name this event data is too detailed (and too technical) for the application specialists who need to interpret the usage of the system from a medical perspective.
To bridge this gap, we took a step back and looked at how an application specialist looks at the usage process. An MRI examination is defined by its purpose (the diagnostic part) and by the applied methods. Therefore, we chose to abstract the purpose in terms of the anatomic region (the body part) that needs to be imaged. In terms of the method, practitioners use a set of scans to produce multiple images that will later on provide evidence for/against a particular diagnosis. So, from the many recorded events we only needed the actual scans.
For the scan events there were also a lot of parameters recorded. For example, the orientation or the contrast of the image can be configured differently for two different scans. Each scan is in fact defined by these parameters from a medical perspective. Different parameter combinations can be stored and configured when the machine is set up (and later during the usage period) to be re-used for different applications.1
So, the usage of an MRI system is defined by the performed examinations. At the lowest level, the usage is thus represented by the parameters of a scan. However, when trying to use all parameters used for a scan to define a scan we realize that comparing two scans becomes a highly complex task for two reasons: 1) for a specific scan, in average, less than 10% of the parameters are used and, 2), the parameter types are highly heterogeneous: categorical, numerical and Boolean.
A solution to the above challenges was found by mapping the logged parameters to so-called tags defined by MRI literature and, at the same time, selecting a reduced number of tags to represent a scan. For the mapping and selection, we used input from medical guidelines and practitioners.
This approach made scan parameters easily understandable by practitioners and facilitated an exam analysis based on expected behaviour and medical guidelines.
From Scan Parameters to Profiles
Figure 2 shows the implemented workflow to define and analyze the usage profiles. First, we defined a mapping from the actual scan parameters to tags. We use domain-specific language (DSL) technology (represented by a combination of Xtext/Xtend) to allow Philips specialists to define the mapping. Once such a mapping is created, the framework automatically generates python code that tags the extracted data.
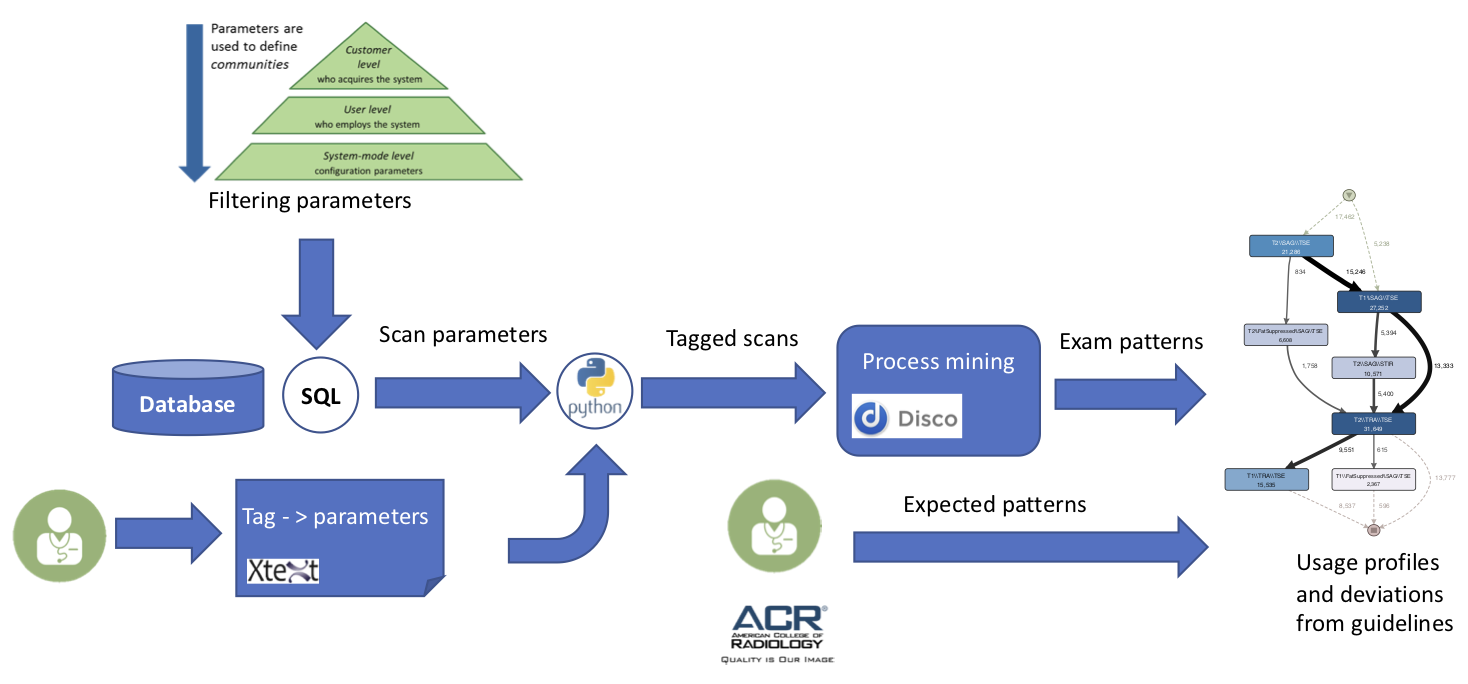
Figure 2: Processing workflow for creating usage profiles
This processed data could now be analyzed with process mining techniques, because the activities were on the right level that MRI specialists could understand.
The big benefit of process mining is that to understand the usage profile of an MRI application you actually need to look at the sequence of scans (not just an individual scan). There could be same type of scan used in the context of a knee MRI as well as for a spine MRI, but the sequence will be different. So, to judge the usage profile one needs to look at the sequences of scans and this is what process mining now allows the application specialists to do.
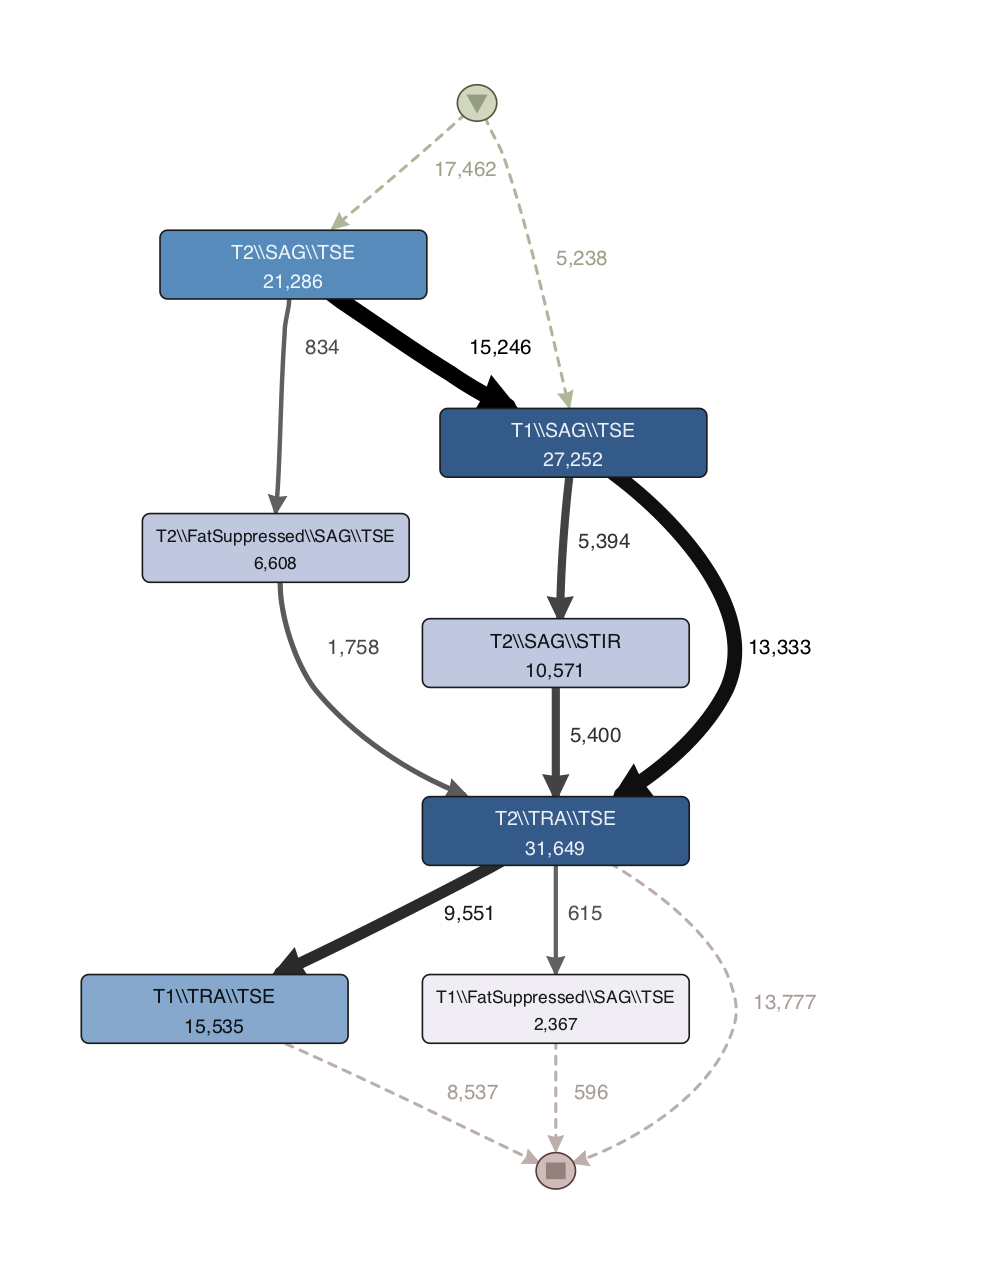
Figure 3: Usage profile created through process mining software Disco
Figure 3 shows a process map that was created based on the tagged data. Each activity is defined by a combination of tags2. The top-most activity node consists of the tags T2, SAG, and TSE, which each refer to parameter configuration in the scan. If the parameter configuration is different than the tag will be different. For example, T1 and T2 are two different tags referring to different configurations of the same parameter in the scan.
Once the usage profile is obtained, a practitioner can compare the workflow with known medical guidelines (such as the ones provided by American College of Radiology ACR).
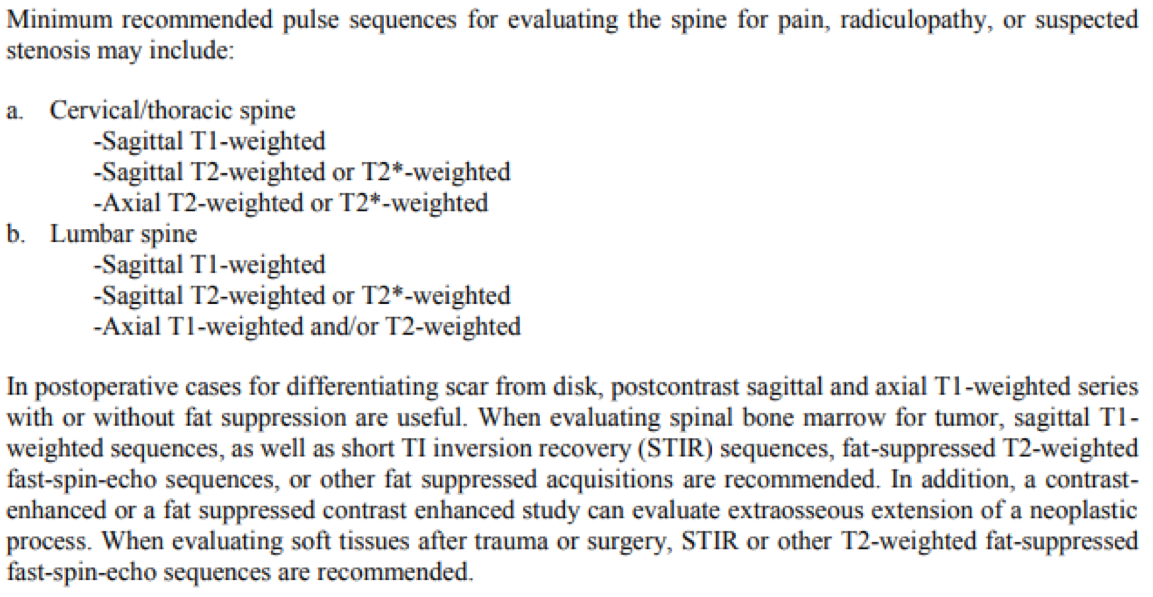
Figure 4: Excerpt from ACR-ASNR-SCBT-MR practice parameter for the performance of magnetic resonance imaging (MRI) of the adult spine (https://www.acr.org/-/media/ACR/Files/Practice-Parameters/MR-Adult-Spine.pdf)
Figure 4 shows an excerpt of the medical guideline for the MRI of an adult spine. This is the medical guideline that belongs to the usage profile shown in Figure 3. For example, the T1 and T2 in the medical guideline refer to the the same tag that has been matched from the event data in the discovered process map.
Note that the thickness of the edges in the process map in Figure 3 is correlated to the number of direct relations between the scans. The thicker the edge, the more frequently the relation is observed in the data.
It is easy to observe that most typical workflow is the one indicated in the guidelines: T1 Sagittal => T2 Sagittal => T2 Transversal (or Axial). However, a number of deviations are observed. These deviations are currently investigated by practitioners to understand whether there are special workflows employed by certain practitioners or there are anomalies due to system/user error.
You can download this case study as a PDF here for easier printing or sharing with others.
-
Note that the set of parameters available for a scan depend on the characteristics of a particular system. Therefore, we decided to focus our investigation on a particular system release. ↩︎
-
To combine multiple columns into the activity name, these columns are all configured as Activity’ during the import. ↩︎
Leave a Comment
You must be logged in to post a comment.