
Top Tricks to Detect Outliers and Anomalies
Blog: The Tibco Blog
Reading Time: 5 minutesMathematically, any observation far removed from the mass of data is classified as an outlier. In practice, outliers could come from incorrect or inefficient data gathering, industrial machine malfunctions, fraud retail transactions, etc. It becomes essential to detect and isolate outliers to apply the corrective treatment. You can use TIBCO Spotfire to smartly identify and label outliers in 10 ways.
1. Use a box plot
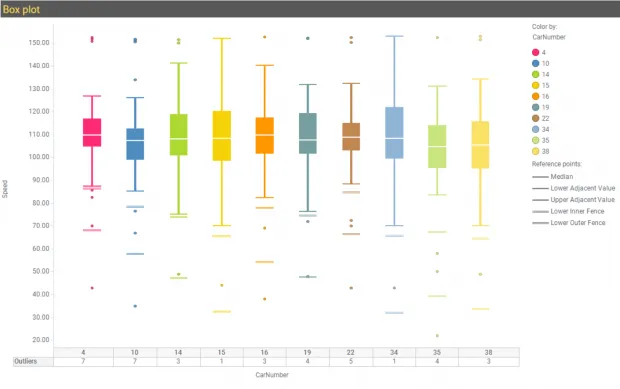
Box and whisker plot (box plot) shows the relationship between a numerical y-variable and a grouping x-variable by using the five number summary—minimum, first quartile (Q1), median, third quartile (Q3), maximum. In addition to the above, Spotfire provides lower adjacent value (LAV) and upper adjacent value (UAV) defined as follows:
LAV = Q1 – 1.5 * IQR
UAV = Q3 + 1.5 * IQR
Where IQR is interquartile range. Any point falling outside of LAV and UAV are marked as outliers. The tooltip label includes additional information about the outlier which is different compared to all other data points in the plot.
2. Configure other plots
Other plots from Spotfire quick access menu that are commonly used to identify outliers:
- Bar chart in histogram configuration to identify univariate outliers
- Scatter plot in QQ plot configuration to identify bivariate outliers in distributions
- Combination plot in Pareto chart configuration to identify outliers based on cumulative value
- Parallel Coordinate Plot (PCP) multivariate analysis for outlier detection
3. Through data panel histogram
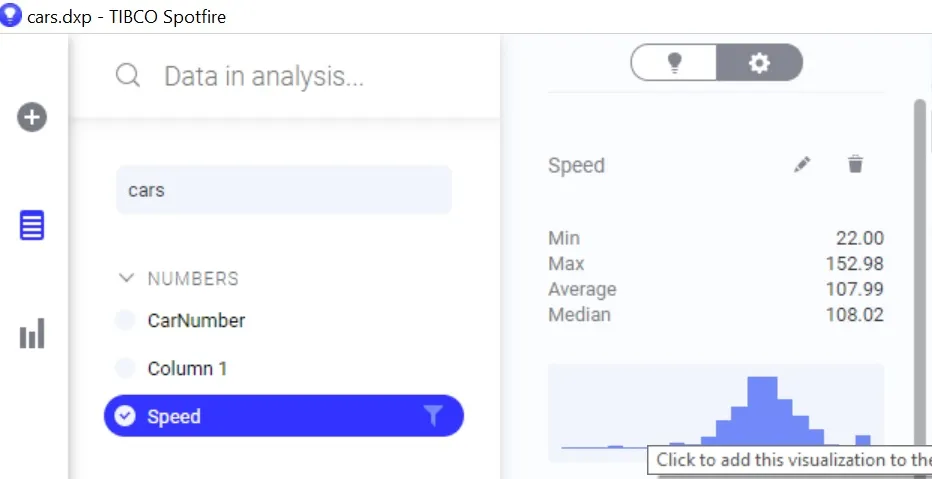
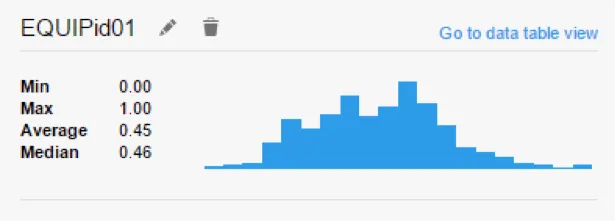
The column overview data panel for in-memory as well as in-db data shows a histogram of distribution for numerical columns. The overview also contains measures such as standard deviance and mean, which when inserted as lines onto the histogram smartly identify outliers for distributions.
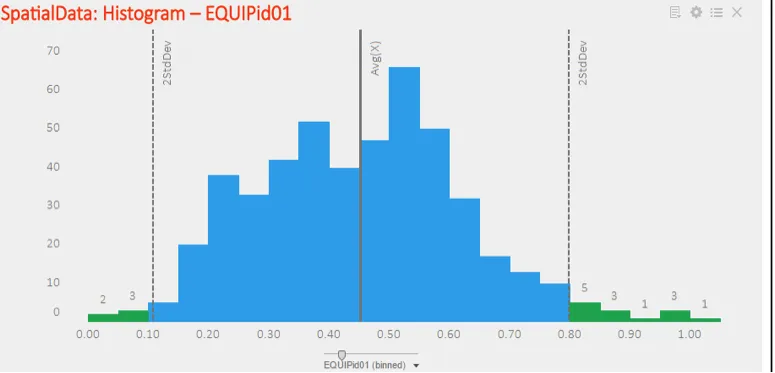
User can also insert custom lines for isolating outliers in multimodal data. Consider the case of data from a standard normal distribution, about 5% of the data falls beyond 2 standard deviations and thus will be picked up as outliers by common statistical tests. But this is just the nature of the distribution that the points follow. For such cases, Spotfire allows you the flexibility to insert lines from custom expressions without depending entirely on predefined methods of outlier detection.
4. Select column aggregation functions
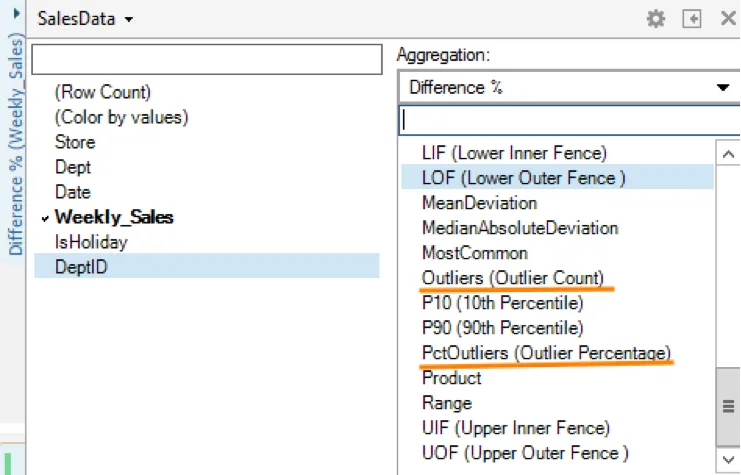
The y-variables for visualization types available in Spotfire can be aggregated to display outlier counts, percent outliers, percentiles and quartiles. These measures can be passed to configuration properties like color schemes described in point number 6 below to visually separate outliers from the rest of the data.
5. Use TERR to detect outliers
Custom expressions, expression functions, and data functions allow the user to extend Spotfire capabilities by seamlessly integrating it with 10,000+ packages from CRAN using TERR or open source R. An example of combining the TERR expression with color could be to choose gradient color scheme based on outlier scores calculated by one line expression:
outlier.score <- Rlof::lof(datacolumn, k=5)
Here, Rlof package contains lof function which is an implementation of widely used Local Outlier Factor algorithm to detect outliers. These scripts map Spotfire data elements (tables, columns, properties, etc) to R function inputs and can be saved and reused across columns, visualization configurations, and more. Such flexibility and extensibility in Spotfire is unmatched by any market contemporaries.
For more extensive analysis like Mahalanobis distance analysis for Outlier Detection, TERR Data functions can be leveraged. Output from the data functions can be automatically plot onto interactive, brush-linked visualizations.
6. Enable color scheme rules
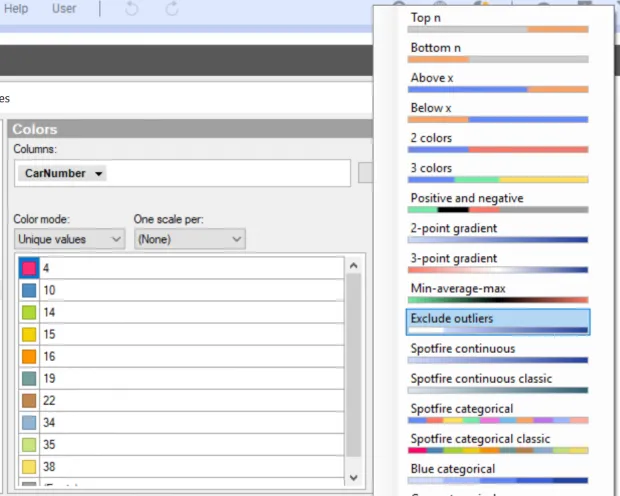
Outliers can be smartly identified using dynamic outlier color schemes based on dynamic rules that the user can enable. These rules include:
- Exclude outlier color scheme in predefined color schemes
- Simplest conditional inbuilt color options for points lesser than the Lower Inner Fence or greater than Upper Inner Fence
- Threshold by mean, median, custom user specified expression
- Use gradient color scheme with dynamic Outlier Scores created in TERR as above
7. Leverage curve fit or regression
Lines and curves in Spotfire visualization properties lets you insert a curve fit or a line fit to the data. This fit can then be used to identify extreme deviate points—outliers!
8. Similarity or clustering
Spotfire provides out-of-box functionality to apply Line Similarity and K-Means clustering to visualizations from the tools menu. The user can choose the similarity metric—Euclidean or Correlation—and other parameters like number of clusters to create line similarity or clustering label column in the data. This column can then be used to color or trellis options.
Stable number of clusters can be found by applying hierarchical clustering on the data. Hierarchical clustering is also available from the tools menu in Spotfire and results in heat map visualization with dendrogram based on distance metric. Sliding the cutoff point to desired position in the dendrogram helps decide stable number of clusters.
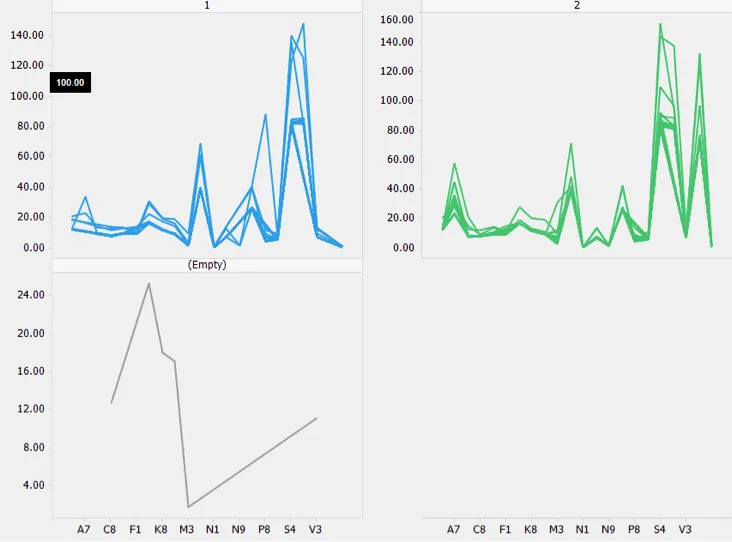
If the data has outliers they will fall into their own cluster, for number of clusters greater than the stable number.
9. Explore advanced configurations
We discussed creating new calculations and columns with expressions, expression functions, and data functions. These can be connected to configuration options that automatically label outliers. Advanced configurations from visualization properties extend beyond the color feature and can be applied similarly to markings, filters, subsets, and labels across visualizations.
10. Templates on Community Exchange

To aid the citizen data scientist, the Spotfire Data Science team makes several plug-and-play templates available for free on our Community Exchange under the ‘Analytics’ tag. These templates allow the user to plug in their data with the push of a button and explore the insights with minimal configuration.
Anomaly detection using deep learning neural nets is one such template that analyzes the input data to find anomalies based on recreation error during unsupervised learning. Another domain specific use case is the quality control template that identifies violations or outliers from the established control limits of the individual points, the moving average, and variance. These templates allow the user to extend the definition from a common outlier to a domain specific outlier and smartly identify and label the same.
How do I learn more?
This summarizes briefly top 10 methods for outlier detection. Watch the page and vote up to get notified about detailed updates. You could also request a featured session on any specific method from above on Dr. Spotfire by:
- Tweeting your question with the hashtag #DrSpotfire
- Posting your question to the TIBCO Community “Answers” section with the hashtag #DrSpotfire
- Contact Dr. Spotfire directly at [email protected]
See also:
- Adjacent values and outliers
- Custom expressions and expression functions in Spotfire
- How to configure Pareto chart from combination chart in Spotfire
- Shewhart control charts and trend charts in Spotfire
- Clustering made simple with Spotfire
- TIBCO Community Exchange for Analytics