TIBCO NOW 2018: The App and Data Challenge
Blog: The Tibco Blog
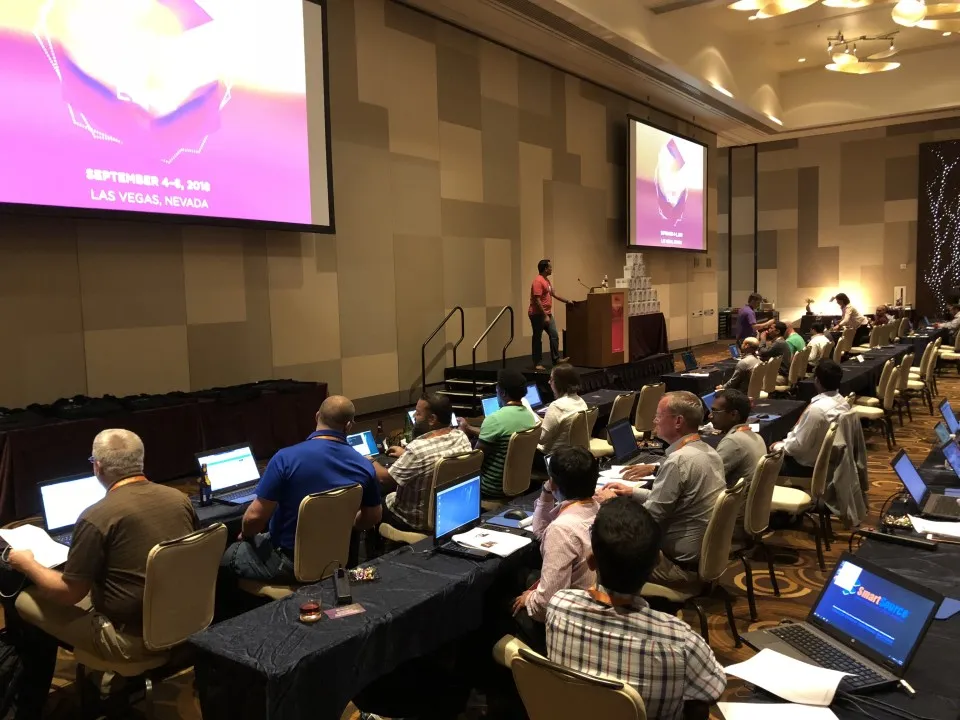
Code challenges are a fun way to engage with developers and enable them to build something innovative. We held one at TIBCO NOW and called it the App & Data Challenge.
With tacos and beer in abundance, great ideas were flowing from the 70+ participants. It was amazing to see the teamwork and the interesting pitches that the judges had to choose from to pick the grand prize winners.
A good code challenge needs to have a solid storyline for developers to be able to think creatively. We had a great story to tell for both the app and the data challenge. Read more below.
App Challenge
The scenario for the App Challenge was the following:
Geoff’s International and Regional Logistics (GIRL) wants to protect its working truck drivers and ensure that they are not a danger to themselves or others on the road.
To achieve this, they installed a Motion Understanding Mechanism (MUM), an onboard IoT device to report statistics about the location of the truck and its journey.
One feature of the device is Driver Attention Detection (DAD). DAD uses a machine learning (ML) model to locally process the image of the driver to ensure that he or she is not falling asleep and paying attention to the road, and is not distracted by anything else like mobile phones. The On-Board-Unit (OBU) in the truck sends data every second on two channels. The first includes location and speed and fuel levels, and the second comes from the DAD and includes the attention data. The driver attention data needs to be further evaluated on a serverless platform alongside the additional data from the OBU using ML inference logic to decide if the driver needs to take a rest break.
We had nine teams with two to five members in each team who built the above scenario while incorporating serverless architecture, AWS Lambda, MQTT, APIs, Flogo, TIBCO Cloud, and many other tools.
The teams were also asked to extend the above scenario, adding their own spin to the story, and present it to the judges. We had a panel of very excited judges who listened to everything the attendees had to say before scoring them on various parameters.
And yes, we had winners.
Team “Ctrl-Alt-Elite” won first place. The judges loved this group’s creative and realistic solution that focused on improving safety for drivers at small companies. They envisioned a pragmatic solution that could be implemented by business users, which leveraged other open source tools and data sources, all integrated via Flogo.
Team “Bots with Dots”, a close runner-up, had a complete vision for another safety-related solution that gathered data around driver speed and attention and coupled it with geolocation info. Flogo would then use ML to find the correlation between the data and predict when a driver was entering a risky location.
Data Challenge
We presented participants with the following scenario: The attendees had six challenges to complete using the world happiness data set. The World Happiness Report is a landmark survey of the state of global happiness and it ranks 155 countries by their happiness levels. It was released at the United Nations at an event celebrating International Day of Happiness on March 20, 2018.
There are two data tables needed to complete the challenge. The 2017 data table includes the Country, Happiness Rank (based off score), Region, and the six factors: economic production, social support, life expectancy, freedom, the absence of corruption, and generosity. The World Countries table was in a shapefile format that included the data needed to map the countries.
Each one of the challenges introduced the participants to various aspects of analytics:
- Map Charts
- Column Matching
- Data Wrangling
- Visual Exploration
- Model creation (Linear regression, predictive modeling)
- Neural networks and many more things.
There were nine teams similar to the app challenge. After the participants completed the challenges using the world health data set, they were then given a brand new challenge using two data sets based on wine data to create a data science notebook. The goal of this new wine dataset, completely different from the world health report, was to make sure that the teams extracted insights using Spotfire and tell us more about the data. The two data sets were related to red and white wines. Only physicochemical (inputs) and sensory (outputs) variables were available (e.g. there is no data about grape types, wine brand, wine selling price, etc.).
These datasets could be viewed as classification or regression tasks. The classes were ordered and not balanced (e.g. there are much more normal wines than excellent or poor ones). Outlier detection algorithms could be used to detect the few excellent or poor wines.
All the teams demonstrated knowledge of the wine dataset through visualizations, explanations, and creativity, presenting their findings to the panel of judges.
And again, we had winners.
Team “Byte Karma” won first place with a unanimous vote by the judges. Byte Karma won for the number of techniques used to explore the data, insights into the top predictive characteristics of wine quality, advanced techniques used to visualize findings, and crisp business explanation of their analysis.
Team “Visual Spectacle” were the runner-ups. Judges appreciated the techniques used, insights, and business explanation of their analysis. But, it was the identification of “a recipe for success” based on the optimal characteristics of wine quality as well as additional ideas to extend the analysis that set this team apart from the rest.
Congratulations to everyone who participated in these two challenges. Every participant walked away with an Oculus Go and the winners with a grand prize.
