
TIBCO Analytics Forum 2022 Hackathon Winners
Blog: The Tibco Blog
This year’s TAF 2022 Hackathon was a huge success! The original limit of 150 hackers had to be expanded to 250 to accommodate the overwhelming demand. All brought their A game.
Spotfire Hackathon Focused on Sustainable Energy
This year’s Hackathon, sponsored by Amazon Web Services, Inc., focused on sustainable energy.
Developed in close collaboration with i2 Enabled, Inc. and Industrial Info Resources, hackers employed multiple data sets on power plants, cooling technologies, drought, and related sources. Their deployment of spatial patterns and temporal trends unlocked insights that can lead to actionable sustainability improvements. It’s a Hackathon with enduring benefits.
Data Visualizations and Sustainable Energy
According to TIBCO CAO Michael O’Connell, “the US uses over 300 billion gallons of water per day. As heatwaves and droughts intensify, pressure on our water and energy sources continues to increase. The TAF 2022 Hackathon gets into this with fresh data on water use, drought, power plants, sustainability, and electricity generation.”
The eight-hour, self-paced Hackathon challenged all participants to use TIBCO Spotfire to create innovative, informative data visualizations that bring new insight to the issue of renewable energy and sustainability.
The judges spent hours reviewing the Hackathon entries. Every submission was thoughtfully considered. Submissions were judged on the following criteria:
- Accuracy
- Completeness
- Creativity
- Aesthetics
And the Winners Are…
Winners showed a remarkable aptitude for data exploration and problem-solving, then conveyed their insights into engaging visualizations.
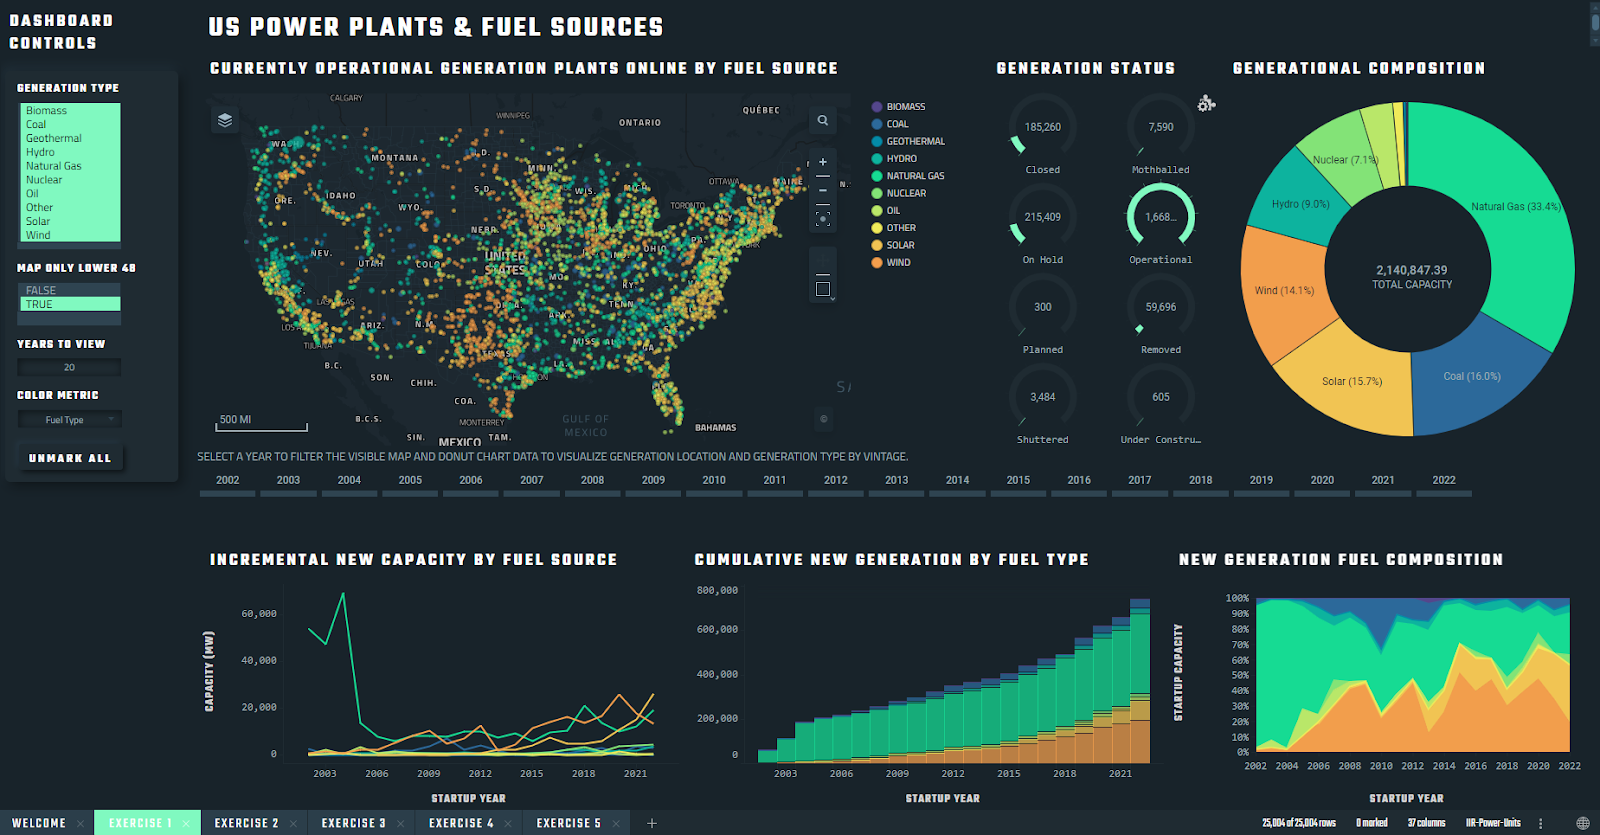
First Place Winner—Jon Henderson: Henderson’s analysis was the most comprehensive, spanning complete solutions with effective visual communication. His work incorporated decisions around graph types, axes, labels, and controls. The color themes were outstanding, and the user experience was intuitive and complete. Presenting so much data within these powerful visuals can help advance sustainable energy efforts.
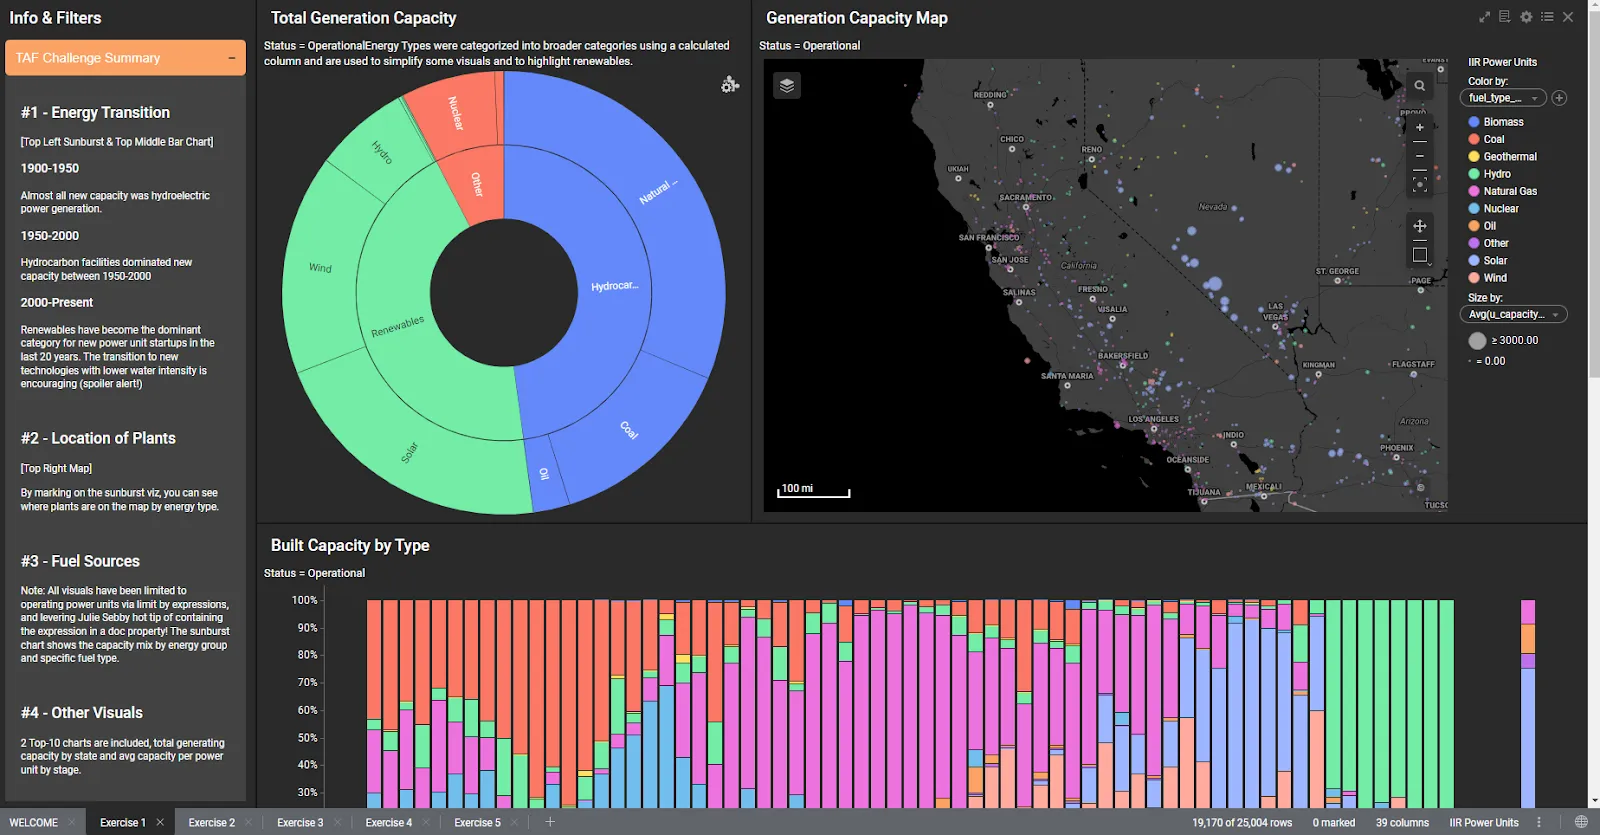
Second Place Winner—Lee Grant: Hackathon judges especially liked Grant’s explanations of visuals in side panels, sunburst charts, and other Mods. They felt his analysis was “on the mark.” Grant also paid particular attention to converting units, managing tables, and presenting his results in a highly detailed scientific analysis. Great job.
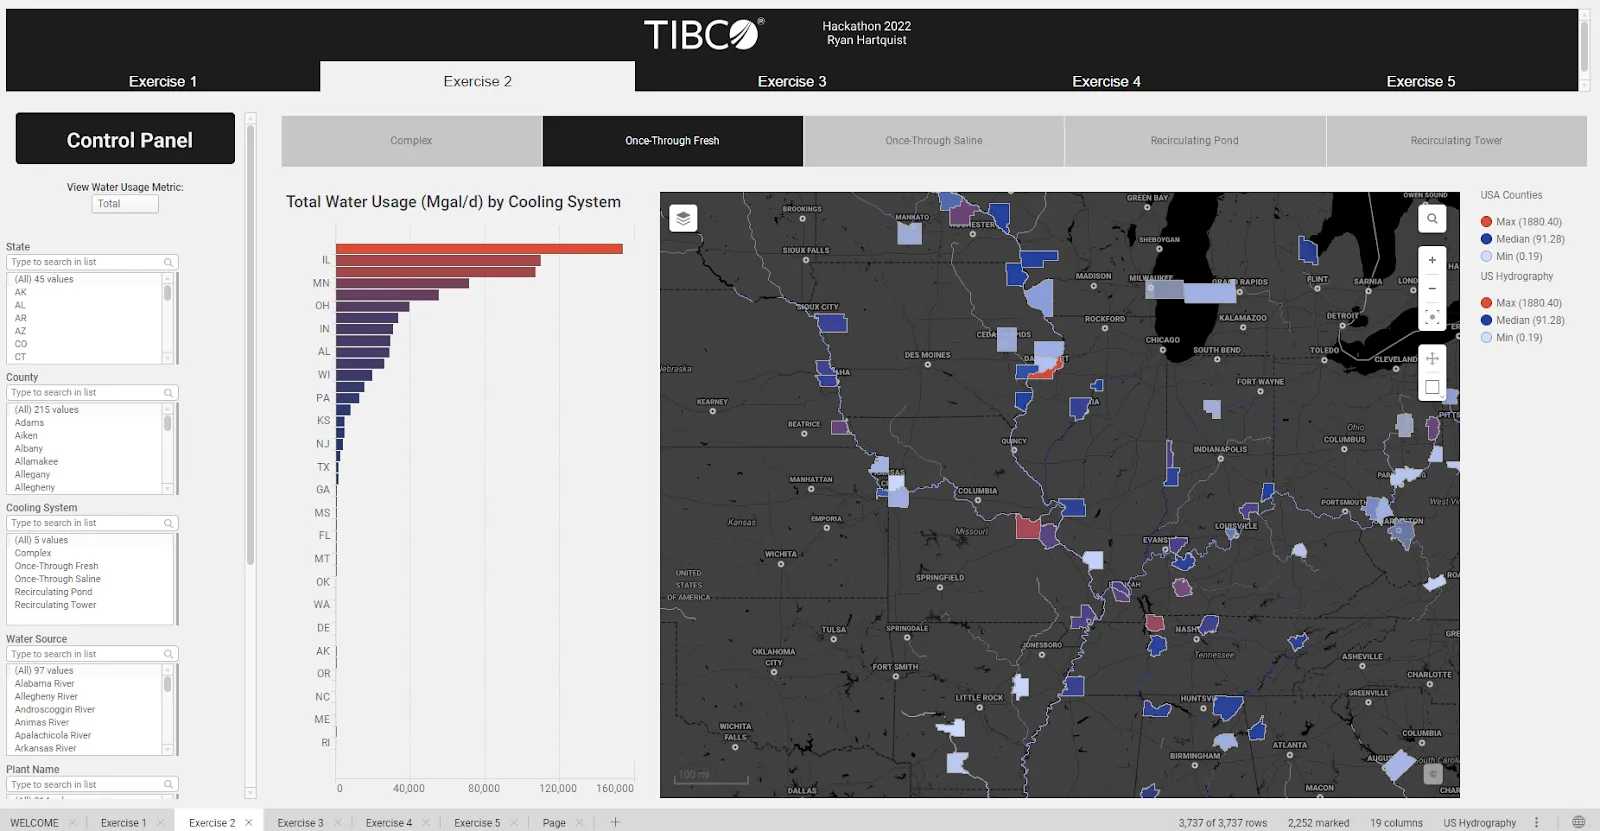
Third Place Winner—Ryan Hartquist: Judges were rightly impressed with Hartquist’s display of water sources used by different counties, user experience controls, chart selection, and overall presentation.
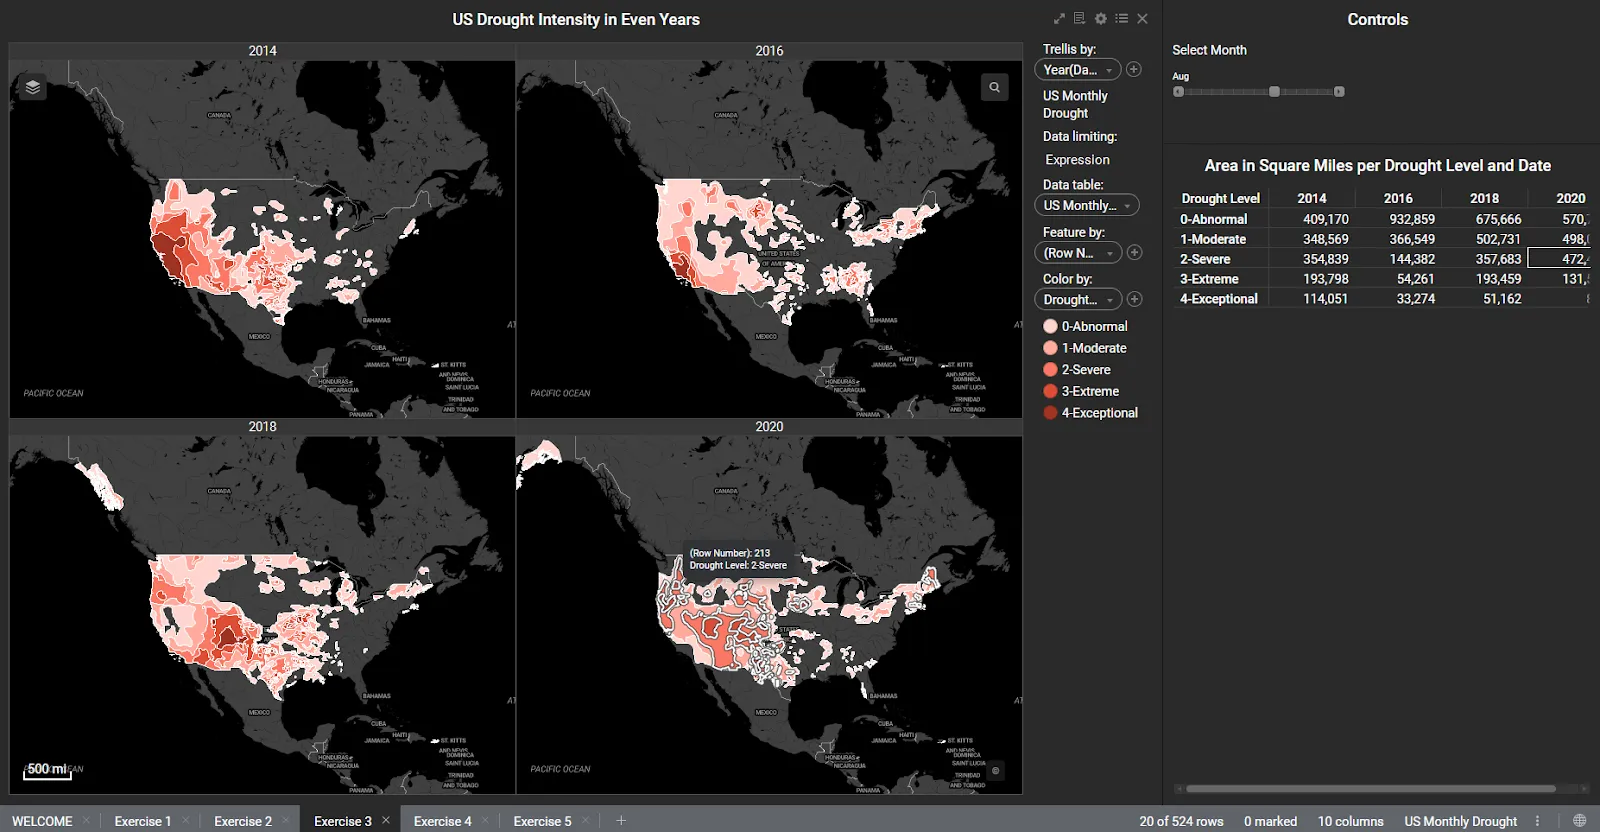
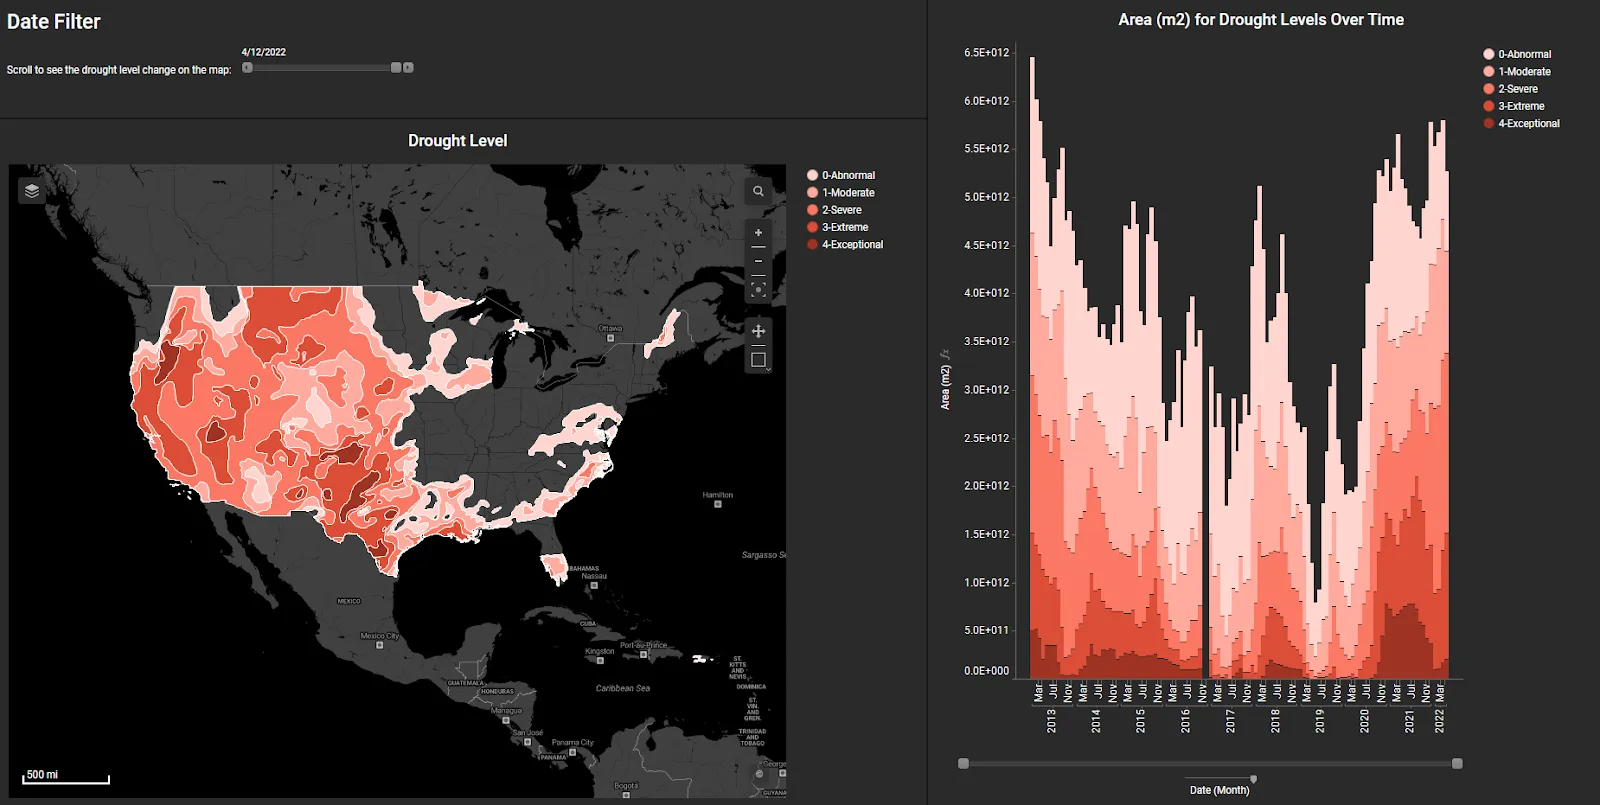
Fourth Place Winner—Jon Orth: This analysis expressed creativity as Orth employed unique visuals to convey results. Hackathon judges commented favorably on the geospatial representation of drought areas easily viewable by month and year.
Honorable Mention—Jade Liu: Honorable mention to Liu, who returns to the Hackathon competition this year with a classic “straight-to-the-point” concise style and presentation. Liu distilled complex data into direct insights.
Congratulations to the winners and to everyone who participated!
What Did the Hackers Win?
What did the Hackers win? The people’s fame and ovation forever, including accolades on our social media channels. There were also prizes.
- First Place Winner—$500 Amazon Gift Card
- Second Place Winner—$400 Amazon Gift Card
- Third Place Winner—$300 Amazon Gift Card
- Fourth Place Winner—$200 Amazon Gift Card
Continue Expanding Your Spotfire Skills
Be sure to return to the TIBCO blog next week for an in-depth analysis of the winning Hackathon entries. See how their visualizations of energy production sustainability will help unlock crucial insights and create a more sustainable world.
Using TIBCO Spotfire to help expand renewable energy efforts and promote sustainability actions—while helping to push visual analytics forward. That’s just one great use of TIBCO Spotfire.
Whether or not you participated in this year’s Hackathon, you can continue to expand your Spotfire analytic skills. Start with attending the next “Dr. Spotfire Office Hours” webinar. Hosted each month by Spotfire experts, the Dr. Spotfire program aims to help new and advanced users overcome unique analytic challenges and improve their day-to-day skills.
Join us for this webinar to learn the latest updates and what’s coming next in Spotfire.
The post TIBCO Analytics Forum 2022 Hackathon Winners first appeared on The TIBCO Blog.