
The Ultimate List of 45 Business Process Improvement Tools (Lean Six Sigma & Beyond)
Blog: The Process Street Blog

“Processes underpin business capabilities, and capabilities underpin strategy execution.” – Pearl Zhu, Digital Capability: Building Legal Like Capability Into Business Competency
A 2018 survey by BPTrends found that 93% of the organizations studied engaged in multiple process improvement projects.
This is because business processes are the life-blood of your organization. Process improvements, therefore, prime your organization to run like a well-oiled machine, bettering your chances of business success.
On that note, in this Process Street article, we take a look at our top 45 process improvement tools. Using these tools will improve customer satisfaction, save you money, strengthen customer retention, and boost project success rate (+ more).
Click on the relevant subheader to jump to your section of choice, alternatively scroll down to read all we have to say.
- Why you should care about improving your processes
- 45 top process improvement tools
- How to improve your business processes using business process documentation
For clarity, I’ve split each tool as per the following subheaders – click to jump to the unique tool category.
- Process improvement visualizations

- Process improvement exercises

- Process improvement frameworks

- Process improvement methodologies

Why you should care about improving your processes
Process improvement is the practice of identifying, analyzing, and improving existing business processes for performance optimization.
A business process is a collection of linked tasks, which find their end goal in the delivery of a given service or product to a client.
This could be by direct means, e.g. sale processes, or by indirect means, e.g. employee onboarding processes.
I like to think of business processes as the veins of your organization, keeping it functioning as a useful asset for your customers.
In a way, you can think of process improvements as essential maintenance, clearing business operational-flow from blockage, and gunk. Without this, your business will soon become sluggish, and out-of-date, meaning you’ll be waving bye-bye  to your competitors while you cough in their dust.
Luckily you’ve come to the right place, as you’re about to find out exactly what process improvement tools you should use to continuously improve processes for your business/line of work.
But first, let’s jump to the facts – as that’s what we care about at Process Street. What proven benefits do process improvements give your organization?
Why process improvements are important
Process improvements will:
- Improve customer satisfaction

54% of process enhancements increase customer satisfaction as processes are adapted and adjusted according to the customer’s needs. - Save you money

Process improvements can save you money. For instance, Triaster stated a client saved over ~$400,000 per year by improving 1 process. - Strengthen customer retention

A structured onboarding program can result in 58% more employees staying with a company for more than 3 years. - Reduce employee onboarding time

The gym management software company, Wodify, uses Process Street to document and improve their business operations. In doing so, the team at Woodify have perfected onboarding, halving the process from 1 month to 2 weeks. - Boost project success rate

Gartner reported that managing your business processes effectively, via making consistent improvements, betters project success rate by 70%. - Reduce business costs

Process improvements set the stage for making continuous improvements in your team and company as a whole, building up cost savings over time. Complete tasks quickly, and bolster team productivity, motivation, and engagement. 46% of companies see business processes as a primal way of reducing business costs.
“[Before Process Street] we would probably hold our new employees’ hands for a good month… But now we’ll show them something for 2 weeks and then we’re able to throw them into things.” – Woodify, 17 BPM Statistics to Help You Increase Efficiency in Your Business
Making process improvements is something that’s helped me as a Content Writer for Process Street. When I first started, I had a hard time editing my work – I needed to improve the process.
I began by documenting my current editing process, creating an editing checklist in Process Street.
I follow this checklist for every article I complete – and yes, this article received the full Jane-treatment. Yet, every time I run through my editing process, I’m looking for ways to improve and update it. Maybe certain tasks aren’t as useful relative to other tasks. Maybe I need to add steps to reflect changes in Process Street’s blog standards.
Ultimately I complete the following:
- I document the process I wish to follow.
- I implement top process improvement tools.
In the next section of this article, I’ll explain how you can follow suit and make process improvements for your organization/line of work using our 45 top process improvement tools. I’ll then explain how you can document your business processes in Process Street.
45 top process improvement tools
Process improvement tools are techniques and methods organizations employ to drive improvements in quality and performance, targeting the processes of a business.
There are a host of different process improvement tools, each uniquely designed to improve a given process uniquely. Let’s take a look at Process Street’s top 45 process improvement tools.
Process improvement visualizations
Process improvement visualizations use imagery to show how a given process can be improved.
Tool #1: Flowcharting
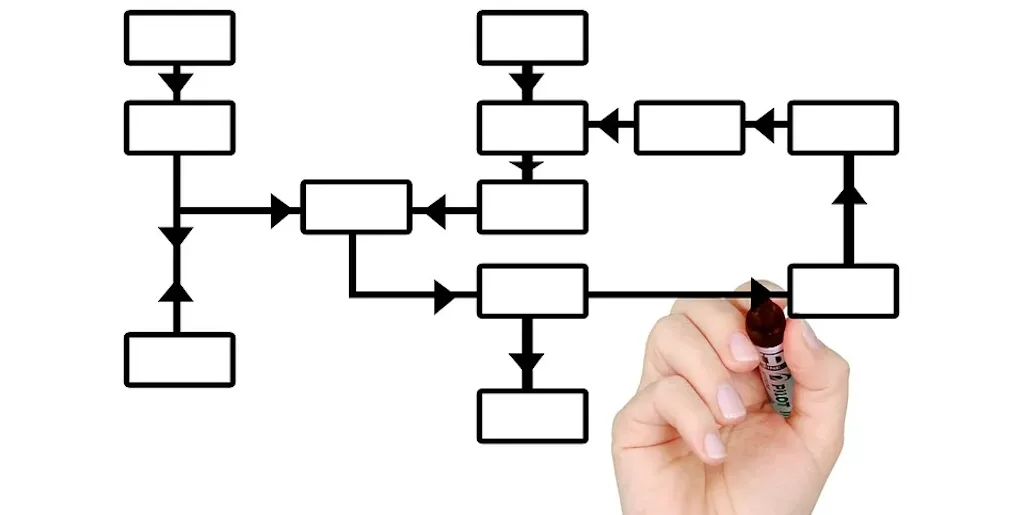
A flowchart pictures the separate steps of a process in sequential order. It’s a generic tool that can be adapted for a wide variety of purposes.
Create a flowchart of the process you’re trying to improve. Then create a flowchart of an ideal process you would like to use. Compare the 2 to decipher the improvements needed.
Read: What is a Workflow? A Simple Guide to Getting Started for more information on how to create a flowchart.
Tool #2: Control charts
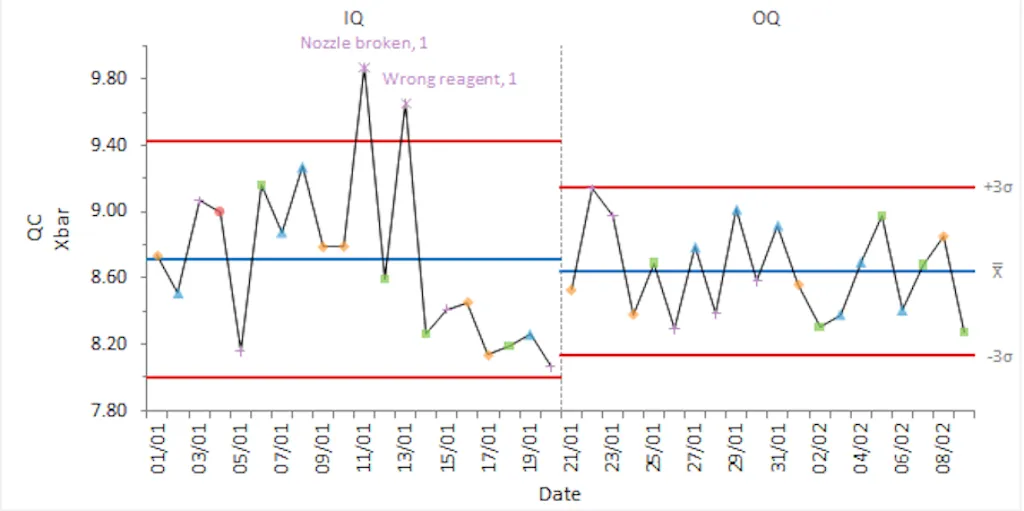
A control chart is a graph used to study how a process changes over time. Data points are plotted in time order, with a central line covering data averages, an upper line for the upper control limit, and a lower line for the lower control limit.
Process outputs can be analyzed based on performance between these 2 limits to identify how/when the process needs to be improved.
Tool #3: Checklists
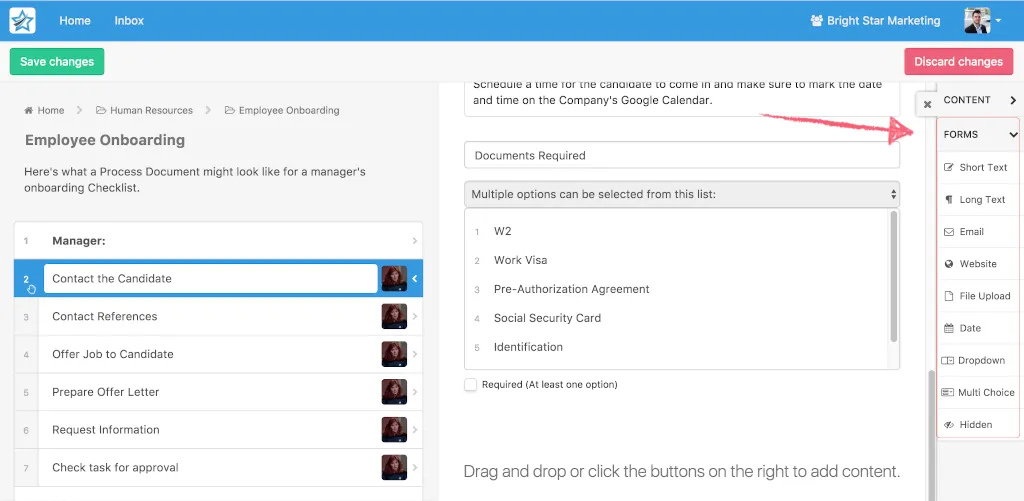
If you’re using Process Street, then you’ll understand how nifty checklists are as a means of visualizing a given process.
Tasks can be viewed in order of completion, with the relationships between different tasks clear.
If you don’t believe me, then read our post The Checklist Manifesto Review for a full breakdown regarding the power of checklists in terms of process control, optimization, and management.
Tool #4: Bar charts
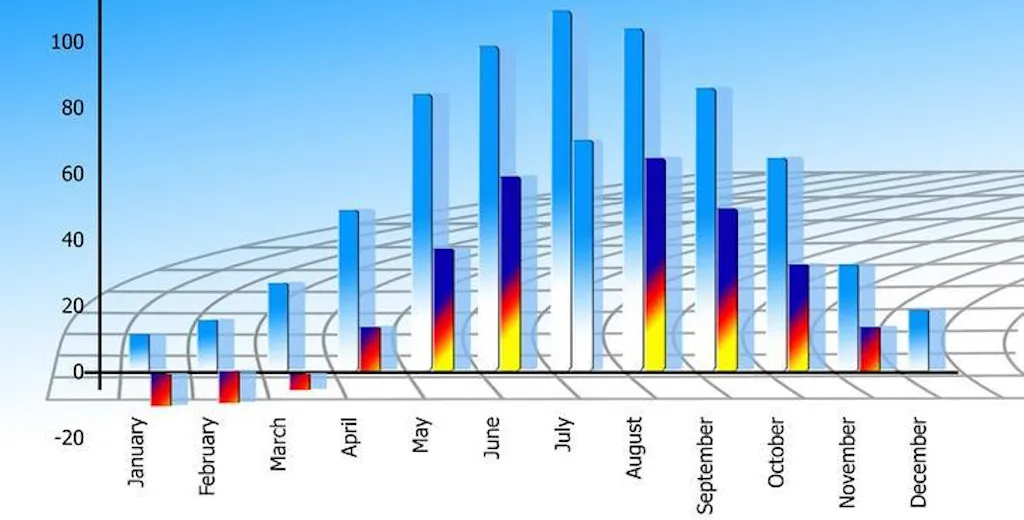
This one takes me back to pre-school. Bar charts are diagrams that convert numerical values of variables to rectangles displayed against an X and Y-axis. Rectangle height is proportionate to the variable value.
Bar charts are a great way of comparing different types of data – e.g. data collected at different time points. In this instance, we’re talking about data that’ll back up your process improvement efforts.
Tool #5: Scatter diagrams
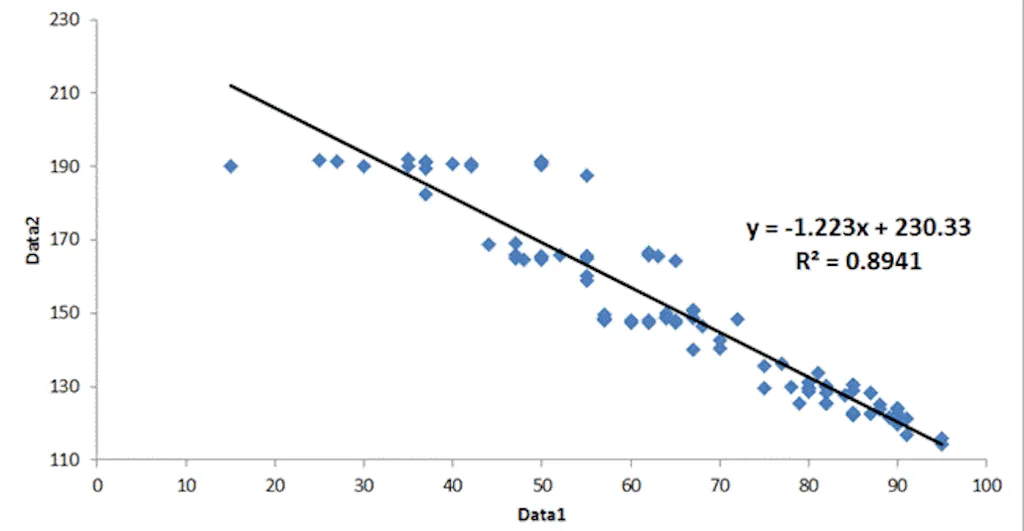
A scatter diagram is a graphical representation of how one variable changes concerning another. Variables are plotted on axes at right angles to each other, and the degree of scattering in the points gives a measure of confidence in any correlation shown.
If you’re thinking about changing variable X in a given process you can use a scatter diagram to see if this will influence variable Y before making the changes suggested.
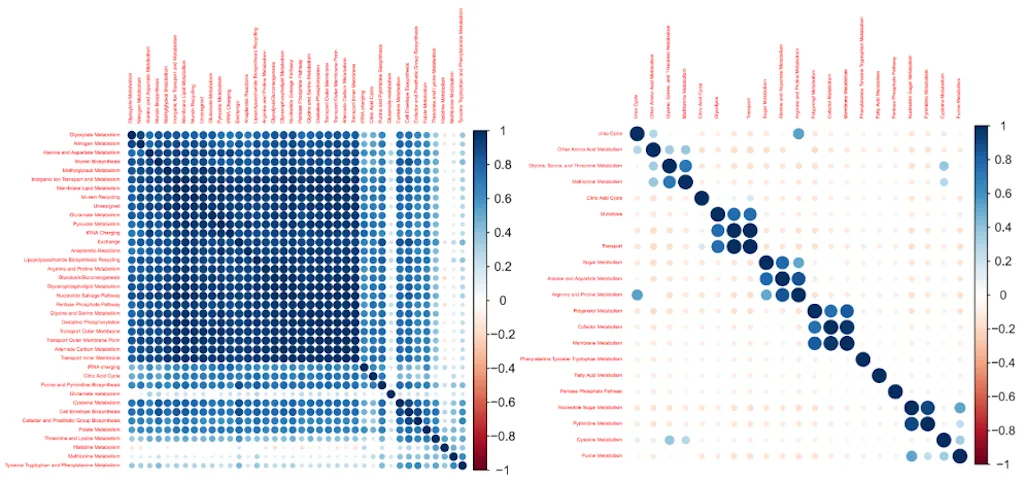
Tool #6: Matrices
A matrix presents data in a rectangular grid, with data displayed along the top and down the side. Symbols are placed at grid intersects to display relationships between different data sets.
Tool #7: Dot plot or tally chart
The dot plot or tally chart shows how often (the frequency) a particular value has occurred. A dot plot is similar to a histogram in that it displays the number of data points that fall into each category or value on the axis, thus displaying the distribution of a data set. Dot plot and tally charts give a picture of variation and highlight unusual values and the probability of particular values occurring.
Tool #8: Histograms
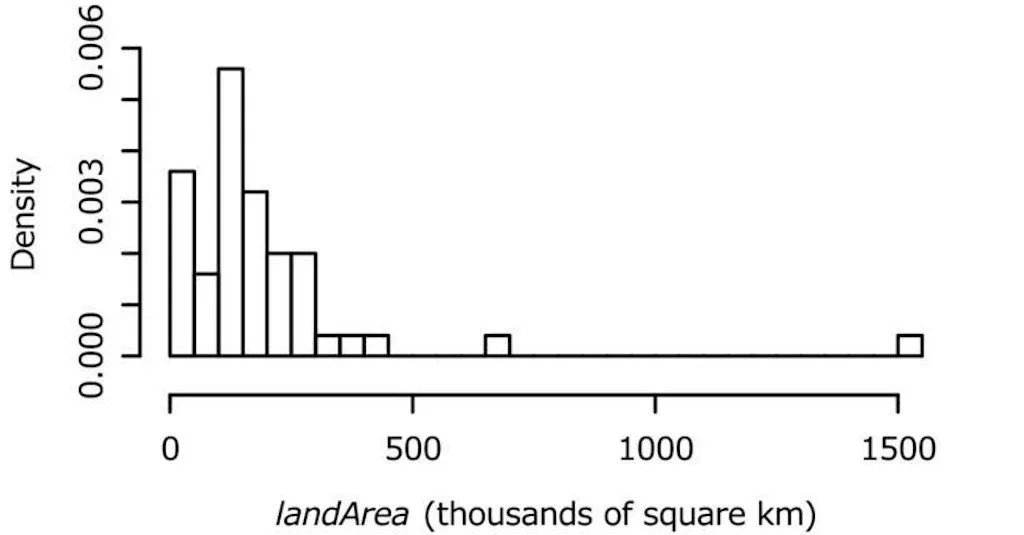
Histograms provide a visual representation of the degree of variation in a data set. Data is grouped into categories. Rectangles are then drawn against an X and Y-axis. The rectangle width represents the frequency of data points in a particular group.
Histograms are convenient for large amounts of data with a wide variation. You can use histograms to look for unusual data spread and to determine the probability that a particular value will occur.
Tool #9: Business process maps (BPM)
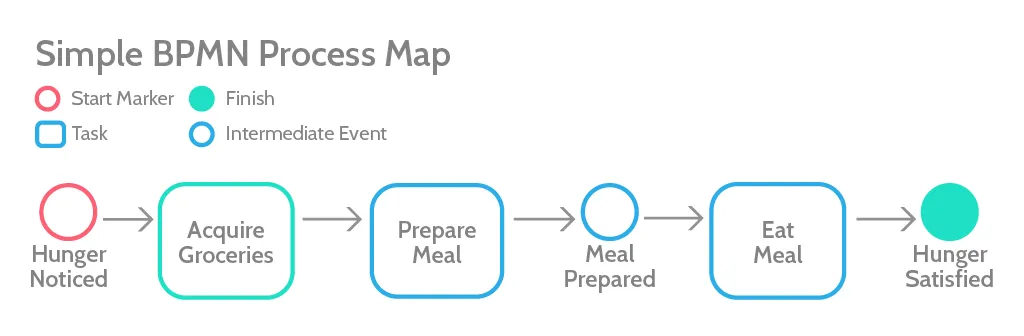
It’s easy to confuse workflows with business process maps, which is understandable as the earliest BPM solutions focused on workflows.
Process mapping, however, goes one step further and generates a comprehensive process diagram indicating workflow information plus more – e.g. the direction of information flows, event types, instances, and users.
Tool #10: Stratification
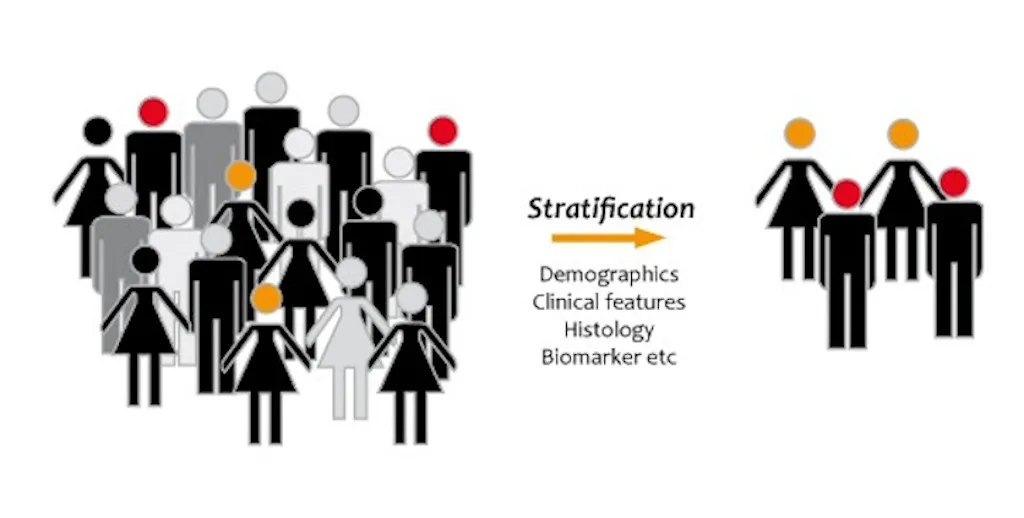
Stratification is the arrangement or classification of something into different groups.
Stratification is a useful process improvement visualization technique, ordering business processes. Processes can be viewed in groups according to the degree of improvement priority, department, complexity, teams, or projects.
Process improvement exercises
Process improvement exercises are activities you can easily carry out. They’re designed to make continuous process improvements.
Tool #11: Process baselining
To make effective process improvements, you’ll need to understand how your business operates and how process improvements can benefit your organization. This is termed process baselining, which provides a starting point upon which your process improvement efforts can be built.
Process baselining involves documenting the process steps, – which you can do in Process Street – understanding where the process breaks down (breakpoints) and identifying areas of waste.
Process baselining gives you the starting point for your process improvement efforts.
Tool #12: Thought showers
Thought showers are an exercise that’ll get the whole team involved and thinking creatively to find a conclusion to a specific problem.
Thought showers gather a list of ideas spontaneously by contributing members. All ideas are noted without criticism, and after the session, these ideas are evaluated.
Tool #13: Pareto chart
A Pareto chart is essentially a plain old bar graph. In the simplest form, a Pareto chart arranges bars from largest to smallest, left to right. The bigger bars on the left are more important than the smaller right-hand bars. The chart provides a visual indication of where an organization needs to focus its efforts to improve operations.
The chart graphically separates problem aspects for the organization to direct its efforts.
If you want to implement the Pareto chart in your organization, use our Pareto Chart Process Checklist.
Click here to access our Pareto Chart Process Checklist!
To find out more about Pareto charts, read: The Pareto Chart: How to Solve Problems & Make Informed Decisions.
Tool #14: Catchball
Despite the jargon term, catchball is simple. A process improvement idea is generated. The purpose, goals, background, and challenges are defined and then thrown to other stakeholders for opinions, help, and action.
The process improvement idea – the ball – is bounced back and forth between team members, clearly dictating who has ownership at any one time.
Catchball connects each layer of an organization and is one of the most effective ways of developing an inclusive culture – everybody is working towards the same goal.
Tool #15: Gemba walks
The term Gemba means the real place in Japanese. During a Gemba walk, managers or supervisors go to the place where work gets done and make observations to identify opportunities for improvement.
The idea behind the Gemba walk is that the staff on the front-line have the best process improvement ideas since they’re the ones running the processes. Small, low-cost, low-risk but significant improvements are made over time.
Tool #16: Takt time
Takt time is a measure of how long each cycle in a system is. Each cycle gives the maximum amount of time that can be spent on 1 product or task before needing to start on the next, to keep up with customer demand.
Processes can be improved based on takt time measures; that is, process time investments can be lessened or increased accordingly.
Find out more about takt time in our post: Takt Time: How Ford Learned to Make WWII Bombers 24x Faster.
Tool #17: Gap analysis
To complete a gap analysis, you’ll need to define:
- The current situation, or performance.
- The ideal situation, or potential.
- What needs to be done to get from performance to potential, otherwise known as bridging the gap.
To help you perform a gap analysis, why not use our Gap Analysis Template.
Click here to access our Gap Analysis Template!
For more information on how to conduct gap analysis, read: Gap Analysis: How to Bridge the Gap Between Performance and Potential.
Tool #18: The 5 Whys
Sakichi Toyoda, the founder of Toyota Industries, created 5 Whys as a process to get to the bottom of business issues.
The best part is that the highly-repeatable 5 Whys process is simple.
You state the process problem you’re facing, and then ask why? You ask why 5 times, with each subsequent response concerning the last answer given. The aim is to get to the root cause of the problem in mind.
Use our 5 Whys Checklist Template to get started with this process improvement exercise.
Click here to access our 5 Whys Checklist Template!
Process improvement frameworks
A process improvement framework is a basic structure underlying an improvement concept.
In this next section, we’ll take a look at top process improvement frameworks.
Tool #19: Value stream mapping
A value stream map represents the process your product or service will go through from the moment you get the materials to the point where you hand your product/service to the customer.
To make a value stream map, carry out the following steps:
- Select the product and scope.
- Create the process map.
- Record the information flow.
- Measure and record current results.
- Make a timeline.
- Analyze the value stream map.
For more information on how to implement value stream mapping to make process improvements in your business, read: Value Stream Mapping: How to Eliminate Waste in Your Processes.
Tool #20: Cause and effect analysis (CEDAC)
CEDAC is a modification of root causes analysis/fishbone analysis, used when you’re trying to improve quality and productivity.
It’s essential to target the right problems, get the right people involved in solving them, and test that the solutions work. CEDAC will help you do that. CEDAC is an acronym that stands for cause and effect diagram with the addition of cards.
For more information on CEDAC and how to implement this methodology, watch the below video.
Tool #20: Hypothesis testing
This one brings me back to my days as a biology student. Hypothesis testing is a comparative analysis of a before and after scenario against a null hypothesis, that is no significant change has occurred.
When making process improvements, data about a process output is collected before and after changes have been made to calculate an improvement probability using confidence intervals.
Hypothesis testing is used during the six sigma analysis stage. If you use our DMAIC Improvement Project Tollgate Checklist, you’ll perform a hypothesis test in task 19. More information on this checklist is provided below, under tool #32.
Tool #21: Force field analysis
Force field analysis is a change management technique originally conceived by the psychologist Kurt Lewin. The model provides a problem overview and splits factors into forces for and against change.
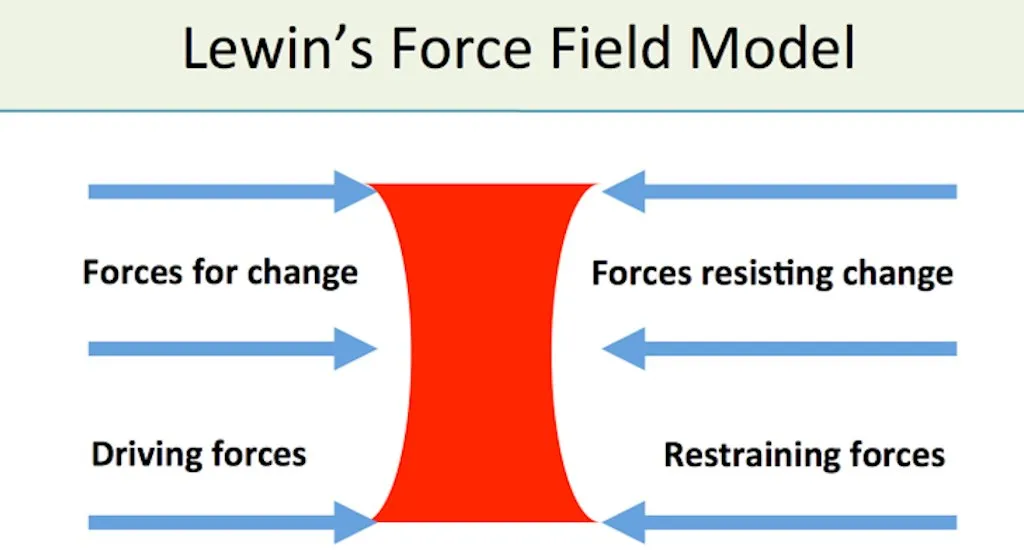
For more information regarding Lewin’s force field model, read: Lewin’s Force Field Model (Change Management).
Tool #22: Statistical process control
Statistical process control is a broad framework that incorporates already mentioned process improvement exercises and visualizations, including:
- Cause-and-effect analysis
- Checklists
- Control charts
- Histograms
- Pareto chart
- Scatter diagrams
- Stratification
This collection of process improvement tools was brought together by Dr. Kaoru Ishikawa and is known around the world as the 7 quality control (7-QC) tools.
Tool #23: A3
The A3 methodology puts lean thinking into action.
The A3 process comprises of the following steps:
- Background: Clarify the problem and briefly describe the current situation and the areas where issues appear.
- Set targets/goals: Set goals based on the current situation.
- Root cause analysis: You can use the A3 process along with our Root Cause Analysis Template presented above.
- Countermeasures: Offer solutions based on the root cause found. From here you can go back to the initial goal and add more details.
- Implementation plan: After setting the countermeasures, you have to present an implementation plan which will include a list of countermeasure actions, responsible individuals, and due dates.
- Effect confirmation and follow-up: Measure the actual results and confirm the effect of your countermeasures.
Tool #24: The 5S’s
The 5S’s is extremely useful for making rapid, continuous improvements. The 5S’s revolves around 5 ideas that make people more effective and efficient in their work. It’s earned its name because each of these 5 principles starts with the letter S as follows:
- Sort: Keep only what is regulary used nearby.
- Straighten: Arrange the space so workers can find exactly what they need to use in less than 30 seconds.
- Shine: Ensure that the workplace and equipment are ready for immediate use.
- Standardize: Each job is done in the same way, and everyone is challenged to offer ideas to improve it.
- Sustain: Foster a safe, efficient, and effective workplace.
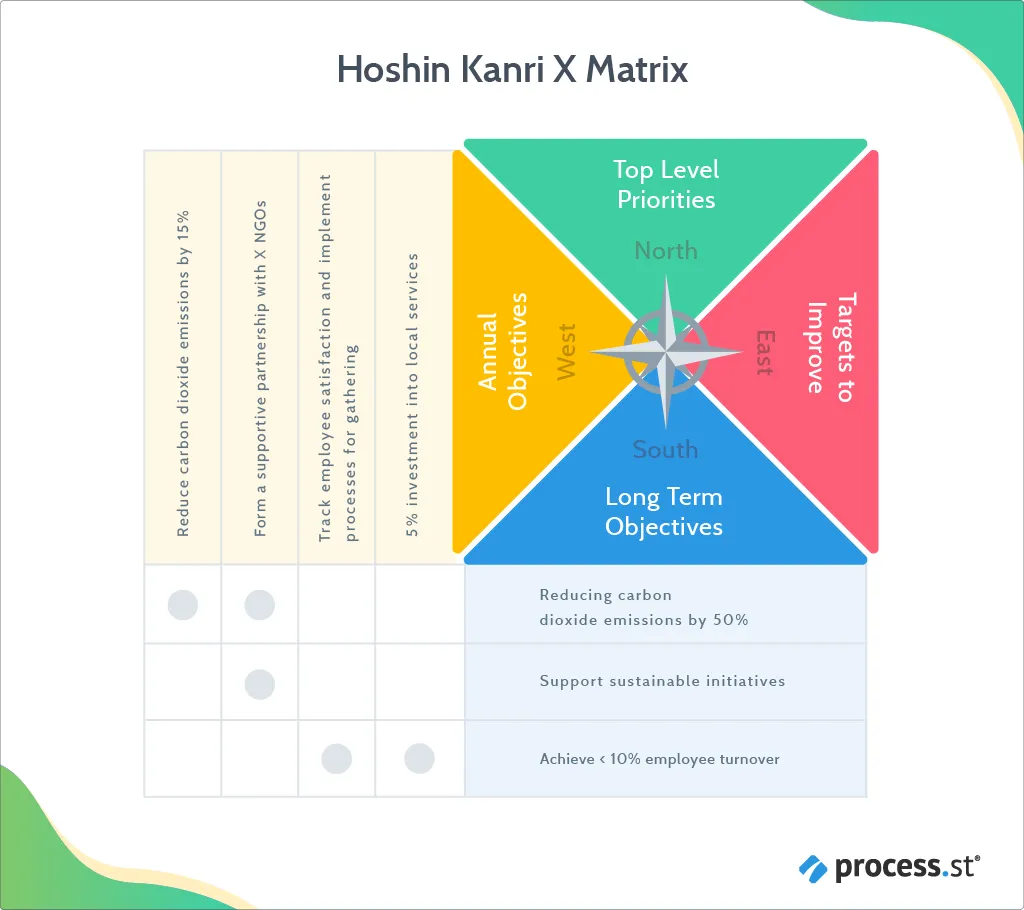
Tool #25: Hoshin Kanri
Hoshin Kanri – also called Policy Deployment – is a strategic planning method that ensures everyone in an organization is driving towards the same goals.
The method moves away from the typical top-down deployment of change, towards a bottom-up approach. That is, everyone in the organization is involved in setting improvement priorities.
The method takes improvement objectives and then breaks these objectives down into smaller objectives, which are broken down further into projects and tasks. To guide you through the Hoshin Kanri framework for process improvement, use our Hoshin Planning: Hoshin Kanri Policy Deployment Process Checklist given below.
Click here to access our Hoshin Kanri Policy Deployment Process Checklist!
For more information on the Hoshin Kanri methodology, read: Hoshin Kanri: Gain a Competitive Advantage With This Lean Management Approach (Free Template).
Tool #26: PDCA
PDCA stands for Plan, Do, Check, and Act. It’s a process improvement tool detailing 4 steps for implementing improvements.
- Plan: The project team determines what they’re planning to change.
- Do: Improvements are made.
- Check: The improved process is compared with the old process to check whether the changes made were improvements at all.
- Act: Everyone involved in the process plays their part in driving the quality improvements.
To help you implement the PDCA cycle for process improvement, why not use our PDCA Cycle Change Management Model Process Checklist?
Click here to access our PDCA Cycle Change Management Model Process Checklist!
For more information on how to use the PDCA cycle to eliminate errors in your processes and for making process improvements, read: PDCA: How to Eliminate Error in Your Processes and Products.
Tool #27: DMADV
DMADV, also known as Design for Six Sigma (DFSS), is used to create new processes at the Six Sigma quality level. If your existing processes do not meet the required quality levels, even after they’ve been optimized, it’s time to do a DMADV to bring about big change.
DMADV consists of the following steps:
- Define: Define what the process needs are concerning what the process delivers.
- Measure: Data imperative to the process is collected.
- Analyze: Data is analyzed and tested. A baseline is set that will be used to measure the process’s improvements.
- Design: A new process is developed that correlated to the process needs.
- Verify: This is an ongoing phase. The team receives feedback regarding whether the new process is delivering the needed output.
For more information on DMADV/DFSS, read: DFSS: How Design For Six Sigma can Supercharge Your Business.
Tool #28: JIT – Just In Time
The concept of JIT is simple: It’s a management philosophy producing what the customer wants, when they want it, in the quantities requested, where they want it, and without delays.
JIT is a pull-system process meaning investments are governed by process demand. This demand-pull means an organization only gives what’s necessary to obtain the required output in the system.
JIT is a framework keeping stock levels of raw materials, components, work in progress, and finished goods to a minimum.
Look at your processes with the JIT framework in mind.
For more information on Just-In-Time production, read: Just-in-Time Production: The Path to Efficiency
Tool #29: Jidoka
A liberal interpretation of this term could be automation with a human touch. It’s a simple way of protecting your company from delivering products of low quality or defects to your customers by stepping in when process automation breaks down.
Jidoka relies on 4 simple principles that ensure a company will deliver defect-free products:
- Discover an abnormality
- Stop the process
- Fix the immediate problem
- Investigate and solve the root cause
By implementing the Jidoka concept, anyone in your organization can stop the process when they notice issues threatening output quality.
For more information on the Jidoka framework, read: Jidoka: Why Automation Plus Intelligence Equals Best Results.
Tool #30: Poka-yoke
This process improvement framework is one of my favorites. Poka-yoke translates to mistake-proofing or inadvertent error prevention.
Poka-yoke is a framework designed to prevent process error. The framework acknowledges the fact that human error is consistent and an ever-present variable in a system. There are 3 types of poka-yoke methods used to prevent process errors:
- The contact method
- The fixed value method
- The motion step method
Find out more about poka-yoke and these 3 different methods by reading our post, Are You Poka-Yoke Woke? Stop Mistakes With This Error Prevention Method (10 Examples).
Tool #31: Prioritization matrix
Prioritization matrix analysis is a task analysis method used to identify and depict relationships between and among concepts.
As a process improvement tool, the prioritization matrix gives stakeholders a reliable process for resolving disagreements and deciding which proposals to focus on.
Use our Prioritization Matrix Checklist Template and run a 2×2 prioritization matrix to order your priorities.
Click here to access our Prioritization Matrix Checklist Template!
Process improvement methodologies
A methodology is a body of methods, rules, and postulates used in a study area or activity. In the next section of this article, we’ll take a deep dive through some of the top process improvement methodologies out there.
Tool #32: Lean Six Sigma
Lean Six Sigma gives a structured approach to scrutinize operations, looking at data and processes to uncover and remove waste.
Implement the lean Six Sigma process improvement tool through the DMAIC – Define, Measure, Analyze, Improve & Control – 5-step model.
Employ the lean Six Sigma methodology using our DMAIC Improvement Project Tollgate Checklist, given below.
Click here to access our DMAIC Improvement Project Tollgate Checklist!
Tool #33: Kanban
The kanban work management system identifies where work gets stuck or blocked. Kanban is a lean methodology used to communicate what, when, and how much of something is needed to be produced through the use of tools such as kanban boards and task cards.
Key features of kanban include:
- Visual workflows
- Finishing what you started (and limiting WIP)
- Workflow management
- Focusing on the process
- Prioritizing feedback
- Continuous improvement
- The Kanban board
For more information on the Kanban process improvement methodology, read: Kanban vs Scrum: Understanding the Tools for Agile Success.
Tool #34: PDSA
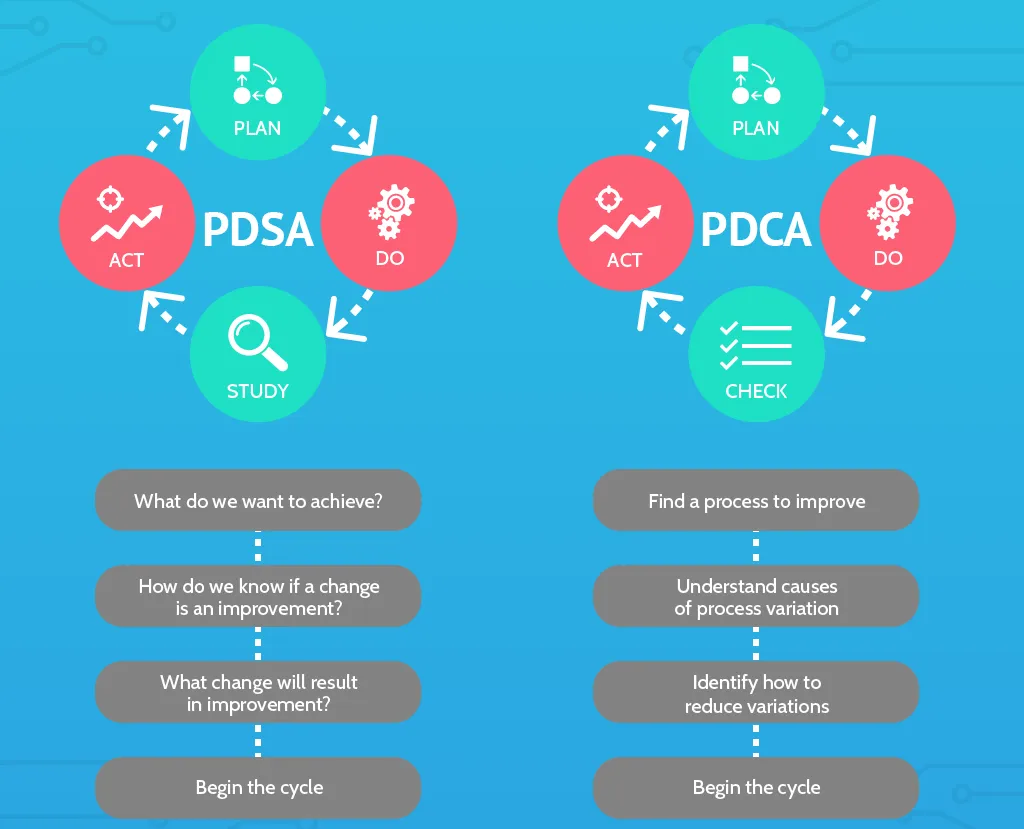
PDSA stands for Plan, Do, Study, Act. PDSA is a more complex version of the PDCA cycle. That is, PDSA should be used as a more extensive method of analysis and reflection. The difference between these 2 process improvement tools is reflected by the replacement of the word check to study.
- Check: This implies you’re asking the question: How does the state of the system compare to what you’re expecting?
- Study: This implies you’re asking the question: What can we learn from how the state of the system compares to what we’re expecting? The study aspect of PDSA suggests that you take what you have learned about a system and use that new information to better achieve the goals of the product or process in question.
For more information on the PDSA cycle, read: How to Use The Deming Cycle for Continuous Quality Improvement.
Tool #35: Heijunka
Here we have another Japanese term, heijunka, which means leveling. Heijunka helps organizations match unpredictable customer demand patterns to eliminate process waste.
Applying the heijunka methodology means you’ll take an average output to keep process production consistent. On days where your output is more than needed, you’ll move excess into a fluctuation stock, and pull out this stock on days where output falls short of demand.
Heijunka is a method that improves stock control processes and relies on a carefully calculated production rate.
Find out more about heijunka and other top lean manufacturing principles by reading our post: 9 Lean Manufacturing Principles to Kill the Jargon and Get Quality Results.
Tool #36: DRIVE
DRIVE is an acronym that stands for:
- Define – the problem’s scope and the criteria used to measure success, agreeing on deliverables and success factors.
- Review – the current situation, understand the background, identify and collect information which includes performances, problem areas, improvements, and quick wins.
- Identify – solutions to the given problem, and the changes required to sustain the improvements made.
- Verify – check that the improvements made will bring about benefits that’ll meet the defined success criteria, prioritize and pilot the improvements made.
- Execute – the implementation of solutions and improvements, plan a review, and gather feedback.
For more information on the DRIVE methodology, read: DRIVE – A Simple and Useful Technique for Process Improvement.
Tool #37: Root cause analysis
Root cause analysis helps you understand the causal focus underlying issues behind your biggest business pain points.
There are many effective methods for conducting RCA, but in our Root Cause Analysis Template you’ll be able to implement the fishbone diagram, otherwise known as the Ishikawa diagram, to dig deep, identify and alleviate the root causes of your process problems and bottlenecks.
Click here to access our Root Cause Analysis Template!
Tool #38: SIPOC diagram
SIPOC is an acronym for Suppliers, Inputs, Processes, Outputs, and Customers.
The SIPOC methodology acts as a tool to identify the inputs and the outputs of target business processes, to determine the process owner, customers, suppliers, and to establish clear boundaries for the process. All in all, SIPOC delivers substantial process improvements on its implementation.
Click here to access our SIPOC template!
Process improvement software
In the final section of this article, we’ll have a look at top process improvement software tools, all vouched for by the team here at Process Street.
Process improvement software refers to the programs and other operating information used to improve business processes.
Tool #39: Process Street
Starting with the process gurus  , Process Street gives you an easy, no-code means of documenting your business processes, meaning you and your time will have full transparency over every given business operation. Once more, these processes are stored in the cloud to be accessed from anywhere at any time – using Process Street’s Permissions feature to control who can see what in a given process and when.
Dive into any process you want to improve, edit the checklist, and update all processes in a second. It’s that easy!
Once more, you can use Process Street’s premade templates, or create your templates for guided instruction on how to implement a given process improvement tool.
Price: Free plan available. The basic plan is $12.50/month. The standard plan is $25/month. Custom plans are available.
Sign up to Process Street for free and get started!
Tool #40: Zapier

At Process Street we use Zapier to connect different applications/to connect applications with their associated processes. This saves us heaps of time, and ultimately improves our processes by removing manual, repetitive tasks. Teams, therefore, have the energy and time to focus on more pressing, higher-priority, and innovative work.
Price: Free plan available. $19.99/month for the starter plan. $49/month for the professional plan. $299/month for the team plan.
Sign up to Zapier for free and get started!
Tool #41: Lucidchart
Lucidchart is your ideal solution for producing digital process improvement visualizations such as workflows, thought showers, and business process maps.
Lucidchart comes with a powerful layering system, allowing you to create diagrams ontop of diagrams. The clean and intuitive layout is easy to understand, with useful collaboration features easing communication between co-workers while you work.
Price: Lucidchart offers a free version. The paid version starts at $7.95/month.
Click here to sign up for Lucidchart and get started!
Tool #42: Visio
Visio is a powerful diagramming and flowchart creation program developed by Microsoft, again useful for creating digital visualizations for making process improvements. Features include flowchart diagrams, collaboration tools, real-time data connection, and the ability to integrate with different applications.
Price: Plan 1 starts at $5.21/month. Plan 2 starts at $15.50/month.
Click here to sign up for Visio!
Tool #43: Statgraphics Centurion
Statgraphics Centurion is a data analysis software built for non-statisticians to seize the advantages of business analytics. The software allows you to run statistical analysis, build models, design experimentations, and create reports that are easy to visualize. The software is a great asset to have for deciphering how well your business processes are running, and whether the changes made add value.
Price: Free trial available but there is no free version. The paid version starts at $765.00.
Click here to sign up for Statgraphics Centurion!
Tool #44: Kanbanize
Kanbanize is a powerful kanban project & portfolio management software. The platform provides several features allowing you to plan, organize, and track work on a team and portfolio level.
Kanbanize is an agile project management software that combines kanban-style features and business automation into a virtual workspace. Features include initiatives and timeline workflows, customizable kanban boards, business automation rules, powerful analytics modules, and more.
Kanbanize is a great tool for implementing the kanban methodology, and for managing project, program, and portfolio processes.
Price: Free trial available. No free version. The paid version starts at $149.00/month.
Click here to sign up for Kanbanize!
Tool #45: Slack
We use Slack daily at Process Street for team-wide communication and collaboration. Slack is a text messaging application that lets you share files. Slack is a powerful interface, one that would appeal to larger companies with high-end features.
Making process improvements via whatever means boils down to effective teamwork, collaboration, and communication. The Slack application supports all of this, removing geographical barriers to communication.
Price: The standard plan costs $6.67/month. The pro plan costs $12.50/month.
How to improve your business processes using business process documentation
Before you can even begin to make process improvements, you’ll need to document your business processes.
“…[B]usiness cannot be run without documentation regardless of its size. From solopreneurs to large firms, all need documentation to keep records of operations.” – Matt Diggity, Diggity Marketing
How can you begin to improve your processes if you haven’t the faintest knowledge of their details?
It’s never been easier to document your business processes. All you need to do is sign up to Process Street for free, and get started.
You can document any business operation in Process Street, using our no-code checklist software.
As you or your team conduct a given process, document the steps and add these steps into a Process Street checklist. For a more detailed explanation on how to document your business processes, read: How and Why to Document Your Workflows.
Use Process Street’s features to superpower your checklists, turning them into dynamic machines tailored to your specific process needs. Add checklist features such as:
- Stop Tasks
 to ensure your documented business processes run in the correct order, and no important task is missed.
 - Dynamic Due Dates
 so you can set due dates on specific tasks, ensuring no business deadline is missed.
 - Conditional Logic
 to create dynamic documented processes that cater to your specific needs each time they are run.
 - Role Assignments
 to ease task delegation within your team, assign a given team member to the relevant task for them to be notified of their job beforehand, streamlining teamwork.
 - Approvals
 allowing decision-makers to give the go-ahead (or rejection) on important items in your documented process. Also, the necessary comments can be provided.
 - Webhooks
 so you can send automated messages or information from your documented processes directly to other apps. A great feature keeping your other tools notified about the status of checklists and tasks in Process Street.
 - Task Assignments
 to assign users and groups to individual tasks in your documented processes, making it easy to see who is responsible for what.
 - Embed Widget
 allowing you to view and interact with other apps without leaving your documented process in Process Street.
 - + more!

“[Process Street has] very clever features that rely heavily on APIs and other apps to extend its benefit and value.” – Greg H., Capterra reviews
For more information on how to document your business processes using Process Street, watch the below video.
All in all, Process Street is an excellent tool to help you continuously improve your business processes. As a software, Process Street facilitates easy process building, process sharing (for feedback and collaboration), and process editing.
Once you have set yourself up with your free Process Street account and you’ve started documenting your business processes, you’re all set to make key process improvements.
In the final section of this article, I’ll explain 45 – yes 45 – process improvement tools you should consider using to make the needed developments for your business or line of work.
Once more, I’ll provide you with free access to the relevant Process Street checklists, selected from the plethora of free templates available in our template library.
If we don’t have a pre-made template for the process improvement tool mentioned, then fear not, as you can easily create a checklist template in your Process Street account to guide you and your team, and implement the tool in question.
Use our top 45 process improvement tools to consistently run A+ processes
Wow, my fingers are dropping off! That was an extensive list of – what we think to be – the top 45 process improvement tools.
By using this list you’ll be well on your way to creating perfect processes for your prized organization.
What are you waiting for?
Here’s to creating optimized, repeatable processes to scale and grow! 
What process improvement tools do you use for your business? What tools are your favorite? Please comment below as we’d love to hear from you. Who knows, you may even get featured in an upcoming article!
The post Blog first appeared on Process Street | Checklist, Workflow and SOP Software.