
The Journey of Generation A(X): Top 5 Highlights from Spotfire 10
Blog: The Tibco Blog
First introduced in the fall of 2018, TIBCO Spotfire®’s A(X) experience, an artificial intelligence (AI) driven analytics experience, delivers agile, augmented analytics for better, faster decision making. Building upon this momentum and listening to user feedback, TIBCO has prioritized several usability improvements and feature enhancements since the last Long-Term Supported (LTS) release (version 10.3) in mid-2019.
Several of these new capabilities—from “Interactive AI” to streaming analytics in the web client to native Python—provide organizations with more accessible data exploration and quicker insights for everyone.
Below are five highlights of the top technology advancements available by upgrading to the latest LTS release of Spotfire® version 10.10.
1. Interactive AI: Insights on Marked Data
With a simple lasso of a data point, AI-assisted exploration answers the questions that you didn’t know how to put into words! Spotfire®’s Recommendations engine automatically identifies interesting patterns in your data, guiding even less-experienced analysts to the most significant relationships to explore. “Interactive AI” aids users by isolating root causes of potential patterns (e.g. an outlier, shifting negative trend).
Takeaway: Interactive AI allows even non-technical users to borrow the brain of a data scientist and create analytics applications in seconds flat—without any expertise—thus shortening the road to insight by simply asking, “What’s different about these?”
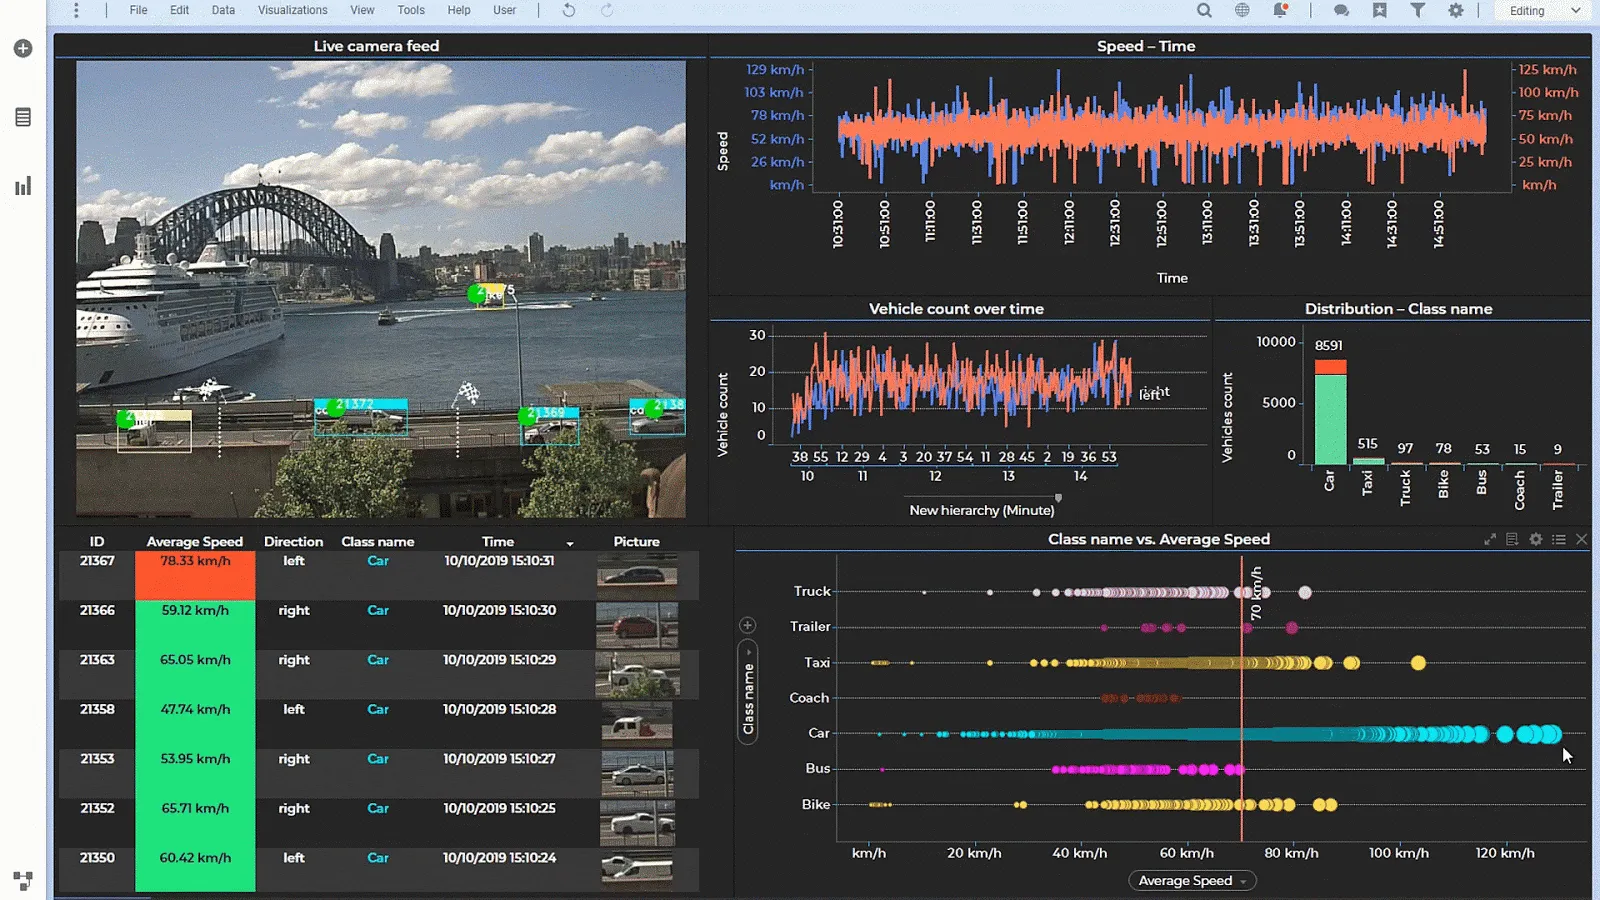
2. Streaming Visual Analytics on the Web
Any business dealing with events data in terms of velocity, direction, and momentum can derive value from streaming visual analytics. Spotfire® provides the industry’s first true streaming business intelligence solution, offering one single visual analytics environment with built-in capabilities for diagnostic, predictive, and streaming analytics.
Streaming visual analytics transforms what was once static, historical rear-view monitoring into an immersive environment for predictive and prescriptive analytics. Streaming visual analytics enables richer insights, served up through dashboards and analyses, that support taking better actions. This is essential because the speed of business today demands:
- Adapting and responding to frequency of rapidly developing events and changing conditions
- Making urgent data-informed (at times automated) decisions based on deeper advanced analytics
Streaming visual analytics transforms what was once static, historical rear-view monitoring into an immersive environment for predictive and prescriptive analytics.
Click To Tweet
Takeaway: Streaming analytics is not just delivering real-time data but also real-time analysis, blending with historical data to inform timely decision-making. Whether for logistics companies, manufacturers, or others seeking operational excellence and cost optimization, streaming visual analytics is imperative. Decision makers are better enabled to act on the most current state of the business when consuming real-time insights via “always-ON” web dashboards and apps.
3. Native Python Data Functions
Our feature in-focus, it’s a case of: you asked and we answered. By popular demand!
With support for writing and managing native Python data functions, Spotfire® provides an interface between visual analytics and advanced analytics with very tight integration. Python has the highest rate of growth among coding languages and is the language of choice for many data scientists, so it was natural for TIBCO to introduce support in Spotfire® for native Python data functions across the Analyst client, web, and Automation Services. Many Spotfire® customers’ IT leaders channeled the voices of their data scientist teams with this request, as this frees them up from manual low-value tasks of duplicating data across different environments. This all allows for the same ease and convenience that users of TERR and “R” language bundled packages have enjoyed for many years in Spotfire®—now for Python.
[*NOTE for users on earlier versions: It was already possible to use Python data functions prior to 10.7 through the data function extension available on the TIBCO Community. However, there’s no longer a need to use that extension as Python data functions are now supported natively right within the environment.]
Takeaway: One TIBCO partner endorsed this as, “…VERY complex analytics on the fly, without leaving [the] environment!” Writing and managing native Python data functions in Spotfire® consolidates several advanced analytics workflows—typically involving several tools—to cut the high cost of task switching.
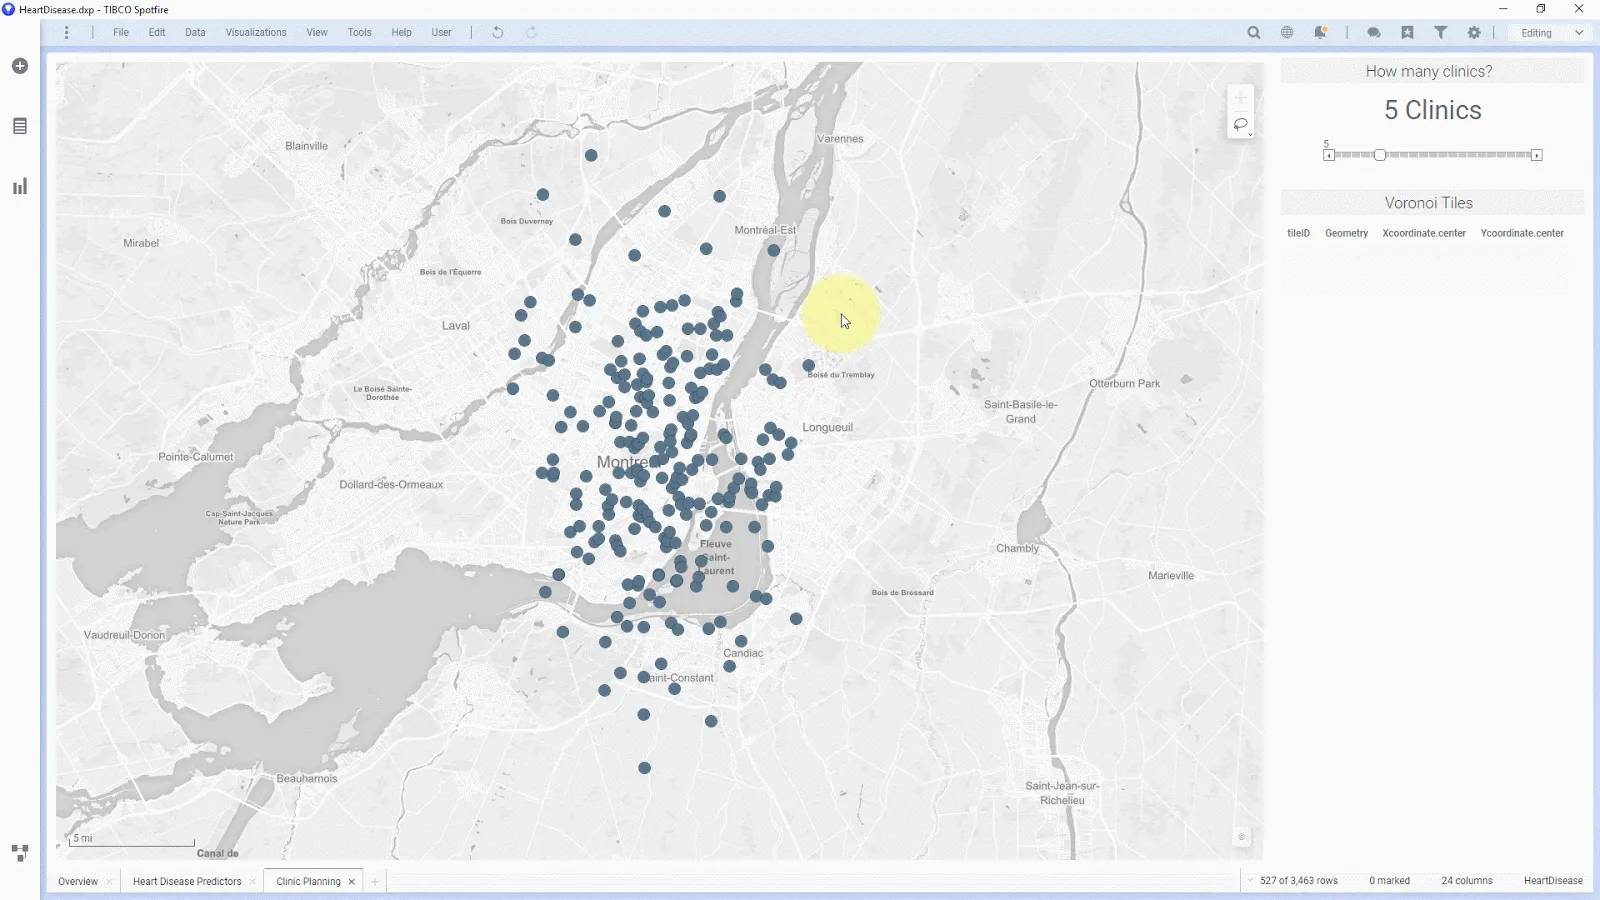
4. Powerful Location Analytics Enhancements
Spotfire® location analytics extends far beyond merely plotting markers on a map. It’s truly immersive and automates the process of creating maps with instant geocoding, enriching the context for spatial patterns and relationships within multiple data layers, map services, and GIS data. It unlocks the use of advanced spatial processing techniques leveraging geographic services and data functions for seamless location-based exploration.
Spotfire®’s latest version now includes all of the following capabilities in map charts:
- Leverage geo-reference info from GeoTIFFs to position images on maps automatically at the right location and with the right projection
- Position images via drag and drop
- Calculate geo-spatial distance for streaming data
- Pan & zoom when Auto-Zoom is enabled
- Ease of use and productivity improvements
Takeaway: In a highly interactive visual application built upon embedded data science, instant recalculations of the models inform new sectors on-the-fly, offering the center of newly drawn areas accelerates the speed to insight.
5. More and More Data Connectivity Added
Native self-service connectors support 59 data sources (and counting!) right in the Spotfire® platform. This list is continually growing, with native connectors to the most popular hybrid cloud databases like Teradata, to applications like SharePoint Online and Salesforce, as well as those really hot cloud analytics data warehouses like Google BigQuery and Snowflake that combine data warehousing with your data lake, just to name a few.
Spotfire® users also connecting to streaming data are able to subscribe to 100+ streaming sources available through Spotfire® Data Streams to blend real-time analysis alongside your historical data.
Takeaway: Rich, disparate data is the core of any thorough analysis. TIBCO is always committed to adding new connectors—both native and custom—to Spotfire®, so customers gain an improved, holistic understanding of their business landscapes and markets.
With these advanced capabilities, innovative organizations can redefine what’s possible with analytics and business intelligence. For a closer look at all of “What’s new in Spotfire®,” explore the recent Dr. Spotfire sessions.