The Curious Case of Myopic Metrics
Blog: NASSCOM Official Blog
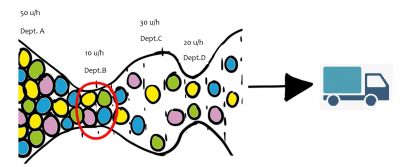
This company by name ‘Calorie Metrics’ produces a popular healthy snack that attracted a huge consumer base. To manufacture this, it has four distinct steps of processing of raw material with a dedicated department for each step. The Dept-A has the capacity to process 50 units per hour (u/h), Dept-B processes 10 units per hour, Dept-C 30 units per hour, and Dept-D completes packaging the finished product at 20 units per hour. The packaged product is immediately shipped to consumer outlets. There is a huge demand for this product in the market and the supply is not adequate to meet the demand.
The challenge before the management team of the factory is to increase the throughput and hence the sales. All Department managers are asked to increase the production capacity and to watch their production metrics very closely. Each manager is given aggressive goals to monitor their metrics to ensure that every department is operating at their peak capacity. What do you think is the outcome? No doubt, there’s a frenzy of activity on the floor and careful collection of production metrics in every department. However, all that focus on the metrics, aggressive targets didn’t result in any tangible increase of net output and sales. However, there is way more activity on the floor with increased work hours and shifts, which is not correlated in any way with increased sales. What was missing?
Not all Improvement plans Improve the outcome
It is not all that surprising that outcome is not favorable in this simple illustrative case. One doesn’t need to be an industrial engineer to predict that despite the best attention of all department staff, managers and a well-intentioned metrics program did not yield the expected result. For example, Improving the processing metric of Dept-A upwards of 50 units per hour (u/h) doesn’t help the output in any way, as its neighbor Dept-B can only process 10 u/h. In fact, improving output of Dept-A causes unwanted flooding at the door of slow-moving Dept-B resulting in spoilage and eventual losses. Even the Dept-B placed rigorous process improvement program and the metric improved from 10 to 13 u/h – a whopping 30% increase in their productivity. Every Department has become a winner as far as its metric goals and MBO’s are concerned. But the company did not gain any visible advantage in terms of sales at the end of their metrics and improvement program.
Is the whole not greater than the sum of its parts?
This situation appears to behave contrary to Aristotle’s “The whole is greater than the sum of its parts”. Metrics programs do not seem to follow this wisdom. I presented an overly simplified process flow to illustrate this point that localized process optimizations and hence the ‘locally optimal’ metrics do not automatically deliver ‘globally optimal’ results. In most cases, improved local optima produce even an inferior global optima.
Let us extend this simple schematic to what happens in our large software projects? A few questions that are worth asking ourselves.
- Are there similarities in our IT context with multiple departments having their own departmental goals and metrics?
- Are the departmental metrics really derived from the Global optima i.e., the organization’s strategic goals?
- Is the connection between the departmental Local Optima and the organizational Global Optima clearly articulated?
- Has there been a validation done for the translation of Local Optima to that of Global?
- How often did we award individual departments for their ‘excellence’ in producing local improvements with no concern to whether those improvements produced organization level results?
Here are some aspects that are worth considering, to take this thinking forward.
What gets measured gets managed
This is a famous quote reportedly said by the management guru, Peter Drucker. There are huge debates about whether or not he really said it. That aside, the spirit of this quote has been taken up by the project managers enthusiastically. During the execution of the projects, anything that is measurable has been measured and a plethora of metrics are created by the project managers. Naturally, we tend to measure what is closer to us, what is in our control, and what we are held responsible for. This caused hyper localization of metrics within each department. Software development managers concerned themselves with their OTD (on-time delivery – from DEV to QA), FTR, Dev Effort Deviation, Dev Schedule deviation, etc. Test managers created metrics that showcased the efficiency of test teams such as the number of bugs raised by QA, test cases per module, Defect leakage ratio, etc. Deployment, release, service delivery teams at the downstream did their own bit to design and track their own metrics. What it results in, is a perfect alignment of people and their behaviors towards those metrics. The moment a metric is placed on watch for the people and teams, the metric magically starts to show an improvement. The bigger question, however remains, Is the chain of ‘right behaviors’ of people in each department is resulting in a tangible improvement of end business results for the company? Many engineers tend to lose faith in the metrics precisely for this reason when they are not able to see any change in the end result of the company before and after the installation of these celebrated metrics programs. Project managers and executives need to reflect on the departmentalization of metrics and the utility of it, or lack thereof.
What’s wrong with Local/departmental metrics?
There is really nothing ‘wrong’ about the departmental metrics. As long as they are used to reflect on the measurement of local processes and to find opportunities to baseline, track local productivity, and trending, they serve a great purpose. But that’s where the utility of the local metrics needs to end. It will be an incorrect long shot to naturally extend their applicability to the organizational level outcomes. The side effect of departmental goals is that the respective managers tend to be overly focused on the utilization of the people, resources, and equipment of the local department. There is nothing that generates more fear and discomfort for a manager to have their people and equipment being under-utilized, particularly when there is a departmental goal being closely watched. The side-effect of this setup is ‘over-production’ in departments resulting in flooding of work, with no concern to whether or not the downstream process has the ability to consume their output. Think of the output of Dept-A in the above schematic flooding the already constrained Dept-B. This is a classic case of localized and departmental metrics in isolation doing more harm than good.
So, how do we fix it? What seems to be the blocker?
It is indeed a great question to start with. If every department is producing at its best, what seems to be blocking the organizational outcome? As the adage goes… A chain is only as strong as its weakest link. In the process flow above, Dept-B, with a production rate of 10 u/h seem to set the pace for the entire production line. Irrespective of the rate of production of other departments, factory output is decided by the output of Dept-B. So, if my goal is to see the higher output of the factory, the only metric that matters most is the Rate of output of Dept-B. This is that ONE METRIC that every department should care about. When the managers and staff of all departments work in unison with a single metric in mind and answer one question for every action they take – “How does this action help increase the output of Dept-B?”, then very different things happen on the floor. In essence, this company needs ONLY ONE METRIC – “Output rate of Dept-B”. This is called “A Constraint” in the flow. The constraint is the one that needs the focus of everyone. This concept is popularized by a remarkable thought leader of our generation Dr. Eliyahu Goldratt in his ‘Theory of Constraints’.
How do I locate a Constraint?
This is not always easy, but in most cases it is. What it requires is a careful observation of THE FLOW. When you imagine a smooth flow of work (in a physical factory or in a virtual software development setup) along a meandering path, it is by mere observation, you notice where the bottlenecks are. In a manufacturing assembly line, it is generally before the constraint, you see a pile of things queued up waiting to be processed. However, in our IT context, it may not always be possible to “see” things. This is where the departmental metrics would come very handy when they are lined up next to each other to establish the pace of the flow of work across the organization. I would use the departmental metrics very carefully to be able to pinpoint the constraints in the system. Once a constraint is located, it is easy to get everyone’s attention to focus on it to alleviate the constraint or to improve the flow thru it to higher levels.
Breaking the Silos
This is a popular cliché that is used in corporate setup quite often. This use case demonstrates a very simple reason why it makes sense to do it. We are not against departments, departmental goals, and metrics. They have an important role to play in the improvement program. Departmental metrics are not the be-all, end-all by themselves. Their role is to be able to act as basic measurements of the flow, the pace of flow, and as local tools of identification of finer variation of things in the local environment. Very importantly, they are useful tools in the identification of constraints in the organizational level flow. Breaking the silos happens when there are those metrics that are single mindedly focused on ‘improving the constraint’ that are given to all the departments. Every department understands one measure of success that matters to the company. There are no resources and people that are ‘captive’ to a department. A department’s success is not measured on its own local metric, but by how much that department contributed towards the improvement of strategic org level output that is designed around the org level constraint. This happens only when the metrics programs are designed with a clear vision towards the strategic org goals and not a measurement program for the sake of measurement.
Measurement and Metrics – Art or Science?
I am sure you are all very experienced in this phenomenon in your respective organizations. You may have come across your organization’s own variation of the metrics program. It would be interesting to step back a bit from your own departmental perspective of the metrics you are collecting at this time and ask some of the questions listed above. You might find a strong connection between the local goals and the organizational goals and how these departmental metrics help you monitor and improve the org goals. You may also be able to locate and question the presence of a constraint either inside your group or outside. You might also like to debate about how the local metrics of your group impact the constraint and how that influences the end goal. A real improvement always starts with a set of right questions. One takeaway I personally had on the metrics programs is that it is more of an Art than science, although a metrics design process generally gives out a perception of being pure science.
I love to hear your comments and look forward to learning from your observations and insights on this topic.
Author : Prasad Vemuri, Sr. EVP, Broadridge Financial Solutions
The post The Curious Case of Myopic Metrics appeared first on NASSCOM Community |The Official Community of Indian IT Industry.
Leave a Comment
You must be logged in to post a comment.