The 5 V’s of big data
Blog: AuraQuantic Blog
The 5 V’s of Big Data are the fundamental pillars supporting a concept that goes beyond the simple processing and systematic collection of data sets that are too large or difficult for traditional data processing software to handle.
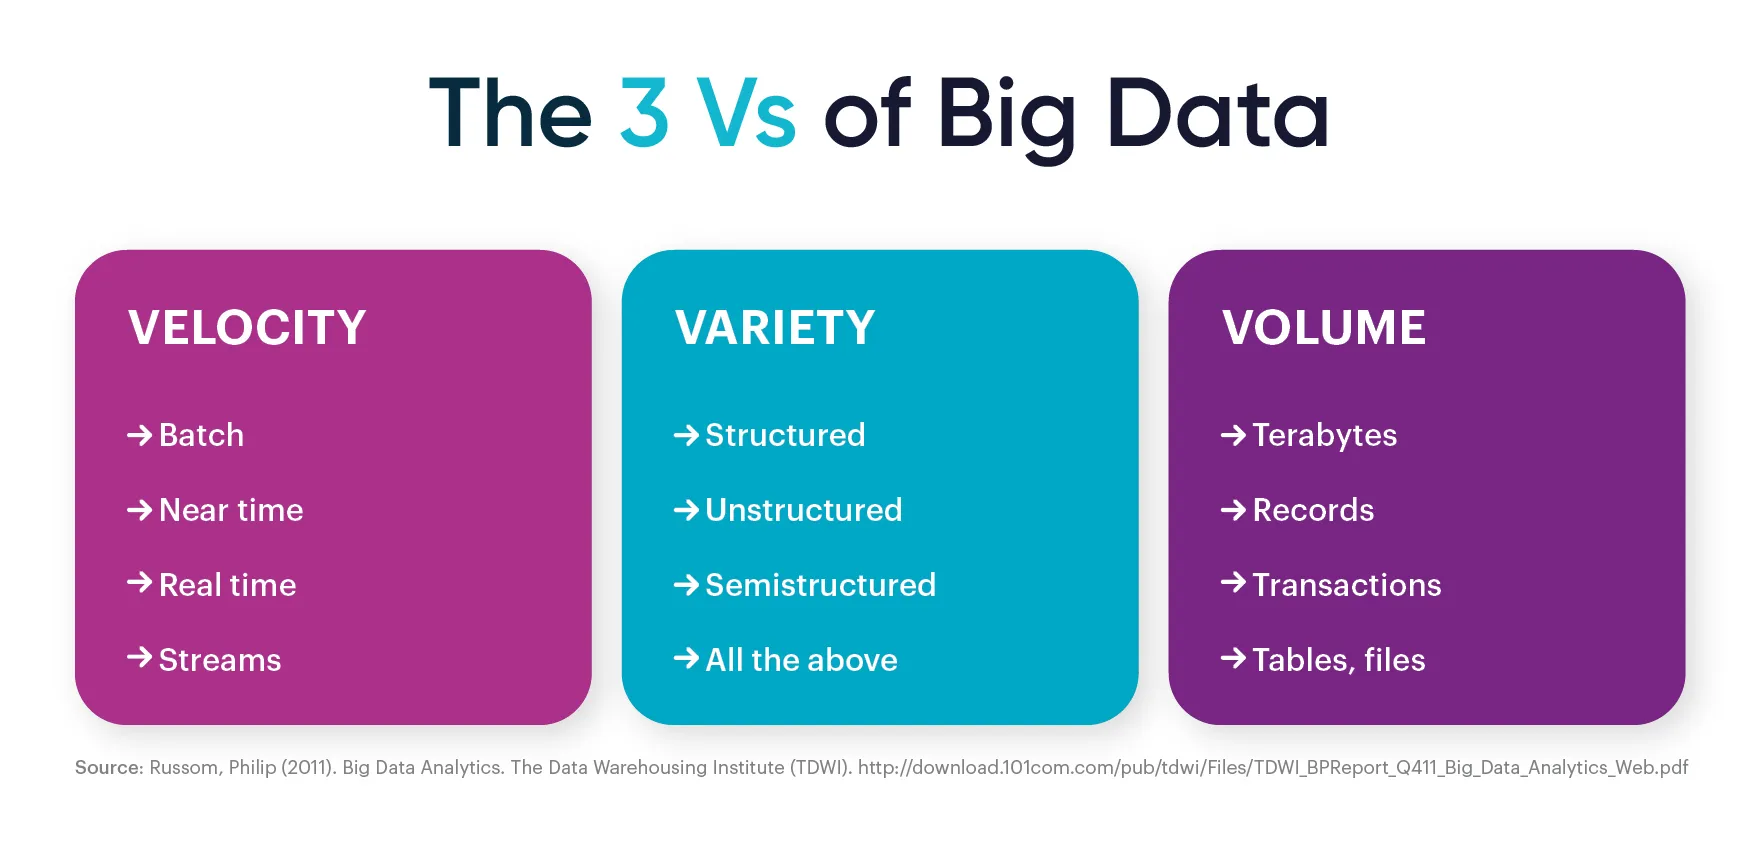
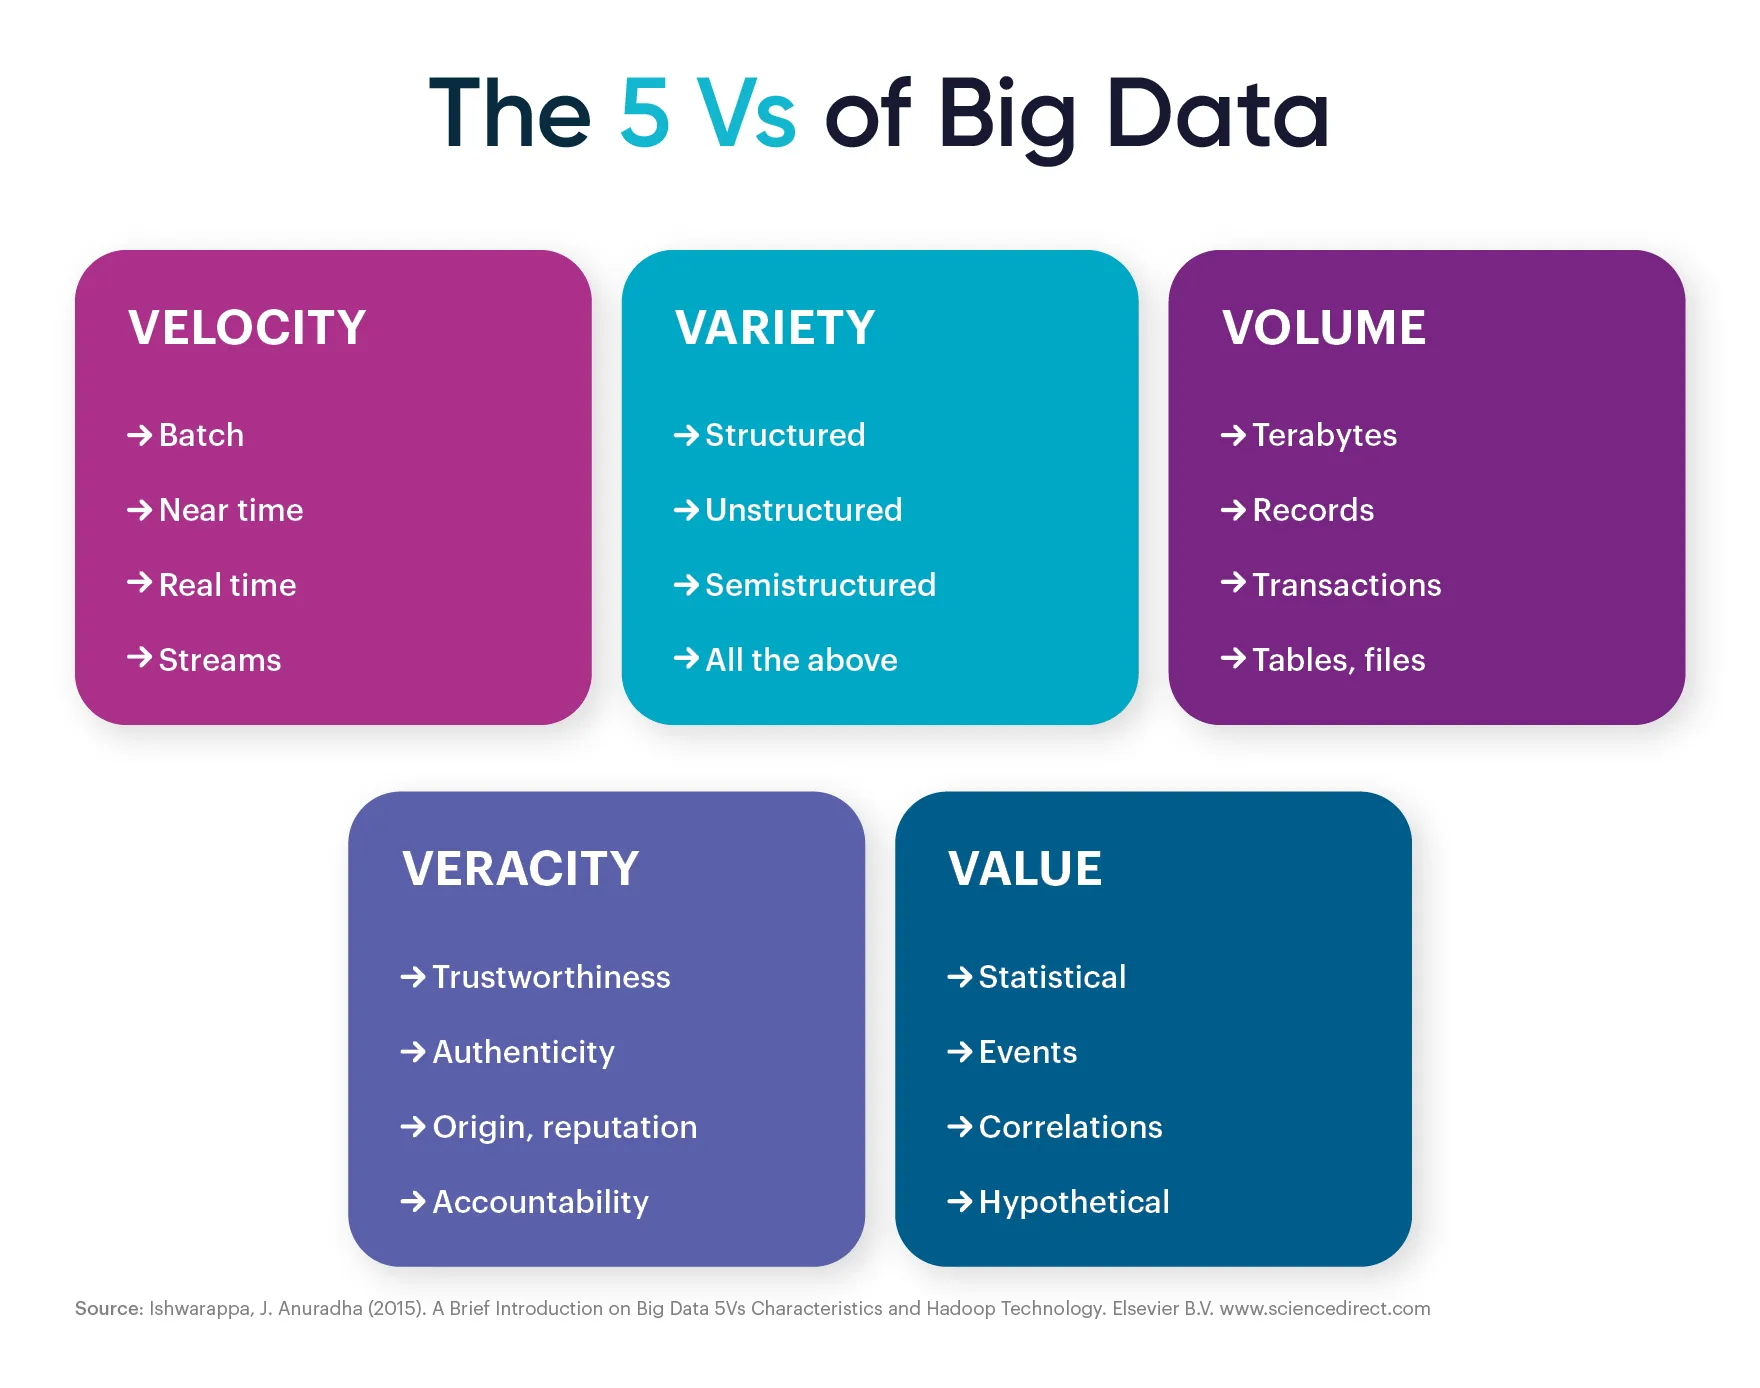
Initially, big data (post link) covered three dimensions, known as the “3 V’s Model”: volume, variety and velocity, over the years, technology experts including IBM and the analyst firm Gartner have proposed a review and expansion of this model. Thus, in some cases, veracity is included as a fourth characteristic of big data; also, in other cases, value is taken into account as a fifth dimension, resulting in the 5 V’s big data model.
Next, we will analyze how the big data V model has evolved in recent decades and the main characteristics on which it is based.
From 3 V’s to a 5 V’s big data model
The concept of big data emerged, back in 1997, in an article published by NASA researchers Michael Cox and David Ellsworth, entitled Application-Controlled Demand Paging for Out-of-Core Visualization. Subsequently, organizations belonging to different economic sectors have referred to this term in multiple ways.
An example is found in a report published by the McKinsey Global Institute, belonging to the consulting firm McKinsey & Company, which defines it as “datasets whose size is beyond the ability of typical database software tools to capture, store, manage, and analyze”.
Sometime later, Doug Laney, an analyst at Gartner, wrote a document entitled 3D Data Management: Controlling Data Volume, Velocity and Variety (2001), in which he analyzed three of the characteristics of big data that would give rise to the three V model: volume, velocity, and variety. This document published by the company META Group, which later acquired the consulting firm Gartner, stated how “The effect of the e-commerce surge, a rise in merger/acquisition activity, increased collaboration, and the drive for harnessing information as a competitive catalyst is driving enterprises to higher levels of consciousness about how data is managed at its most basic level”. This report constitutes the starting point for the theoretical models that emerged years later and that incorporate additional characteristics related to the concept of big data.
In the case of IBM, the company has always kept the classic 3V’s in mind, along with veracity. While, during the celebration of the First International Symposium on Big Data and Data Analysis in Collaboration (BDDAC), important researchers such as Yuri Demchenko defended the inclusion of the characteristics: volume, velocity, variety, value, and veracity in the definition of big data. An approach that appears in the report Addressing Big Data Issues in Scientific Data Infrastructure, shaping the 5V model. Later, other companies, like Microsoft, incorporated new features, such as visibility, further expanding the scope of the concept.

In parallel and as the years went by, the existing data categories were joined by others resulting from the emergence of new big data manipulation tools: semi-structured and unstructured data. This, in addition to the gradual increase in data volumes, led multiple organizations to consider the business opportunities of this new infinite resource. These include understanding the value that customers place on products and services, to perform a more effective segmentation and personalization; discovering the present and future needs of the different audiences and customers to develop new products and business models; optimizing industrial production processes to develop preventive maintenance strategies and improve the effectiveness of equipment.
Thus, organizations are increasingly opting for big data solutions to support their business strategy and solve all problems related to data management at a corporate level.
The 5 V’s or characteristics of big data
According to a study published by the consulting firm IDC, entitled The Digitization of the World, it is estimated that, in 2025, the volume of data generated globally will reach 175 zettabytes. A figure that, taking the year 2018 as a reference, with a global volume of registered data that reached 33 zettabytes, represents an increase of 142 zettabytes. Faced with this situation, organizations must have tools that allow the effective treatment and analysis of mass quantities of data from a multitude of information sources, such as document scanning, images, bank transactions, emails, social networks, etc.
Now, although there are different approaches when it comes to visualizing and understanding the nature of data, we will take the 5V model as a reference to try to understand and delve into the nature of this concept.
1. Volume:
Terabytes were first, followed by petabytes and exabytes until you reach zettabytes. Year after year, the volumes of data handled by organizations continue to grow and this trend is expected to continue over time. So much so that, according to the research firm Fortune Business Insights, “the global big data analytics market size is projected to reach USD 549.73 billion in 2028, at a CAGR of 13.2% during the forecast period”.
As its name suggests, big data is comprised of large amounts of data, which ultimately defines the word “volume”. However, this first characteristic of the 5 V’s of Big Data includes qualities such as the size, scale, quantity and magnitude of the data, which must be easily accessible, searchable, processable, and manageable.
Volume is one of the most important dimensions of big data since it has imposed specific and additional requirements on all the technologies and tools traditionally used for its processing.
2. Velocity:
Faced with massive volumes of data, the rate at which the data flows must also increase. Thus, velocity is added as another feature within the context of big data. As there is a continuous circulation of data, it is necessary for its collection, processing and analysis to be carried out at the same pace or speed, to extract valuable information.
3. Variety:
The large volumes of data generated, processed and analyzed include data of any type (structured, semi-structured and unstructured). An effective analysis of all data sources, also known as big data analytics, enables organizations to achieve a better understanding of their environment and of the company itself, optimize decision-making, meet customer needs, reduce costs, optimize processes and even achieve new sources of income.
4. Veracity:
When we talk about this characteristic of the 5 V’s of Big Data, two aspects must be taken into account: statistical reliability, that is, the consistency or degree of certainty of the data; and, the reliability of the data, which depends on a series of factors such as the origin of the data, the methods of collection and processing, the infrastructure and the computer facilities used. Therefore, the veracity of big data guarantees that the data is reliable, authentic, and protected from unauthorized access and modification, throughout its life cycle. Thereby, a correct interpretation of the information is ensured, as the variety and number of existing data sources increases.
5. Value:
This fifth and final characteristic can be defined as the added value or utility that the collected data can bring to a decision-making process, business activity or analysis. However, for data to be useful, it is necessary to convert it into knowledge. This requires the use and combination of different technologies such as data mining, predictive analytics, text mining, etc. This aims to achieve three major business objectives: cost reduction, quick and effective decision-making, and the design of new products or services.

The post The 5 V’s of big data appeared first on AuraQuantic.