Spotfire Tips and Tricks: Embedding Spotfire Visualizations on Webpages
Blog: The Tibco Blog
TIBCO Spotfire is the industry leader for creating sophisticated visualizations with detail drill-downs using the drag-and-drop, right-click-and-configure functionality. The tool supports a host of pertinent visualizations such as KPI charts, box plots, map charts, and more, and customizations are possible on each one. Creating the same visualizations from scratch to be embedded into web pages would take weeks of complex programming work. So often a Spotfire user is daunted by the lack of user-friendliness, flexibility, and options in configuring the same visualizations on their web pages as they see in their analysis.
This post is aimed at providing the structure to take the visualization and pages inside a Spotfire analysis and embed them onto a web page. Such a web page setup can then be dropped into any of your web hosting containers. This embedding works seamlessly with common web technologies like Bootstrap and jQuery. The following tutorial requires a prerequisite—a basic understanding of HTML and a user-created and saved analysis on a Spotfire server.
The user can sign up for a trial TIBCO Spotfire Cloud Account here. Save the analysis in your public directory. From the saved analysis we will need the following pieces of information as shown:
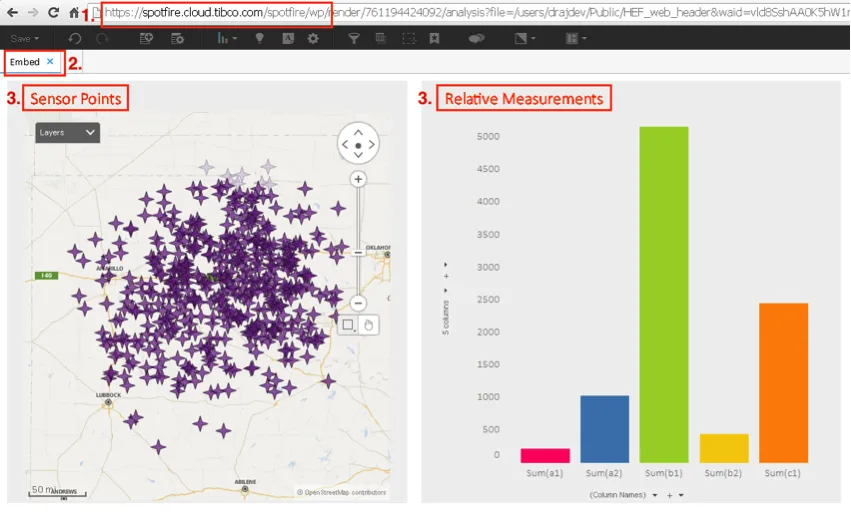 1. URL of the TIBCO server hosting the analysis
2. Name of the page from which you would like to embed the visualizations
3. Optionally, name of the visualizations to be rendered on the web page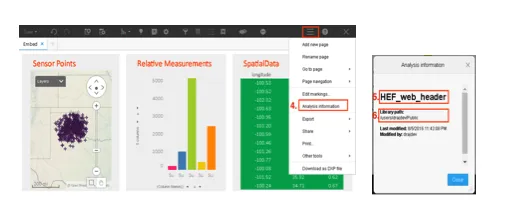
Open the Analysis Information from the menu as shown.
From this you will need:
5. Name of the analysis
6. Library path to the analysis
On the source script of your page say <name>.html the above pieces that now need to be included, as shown below:
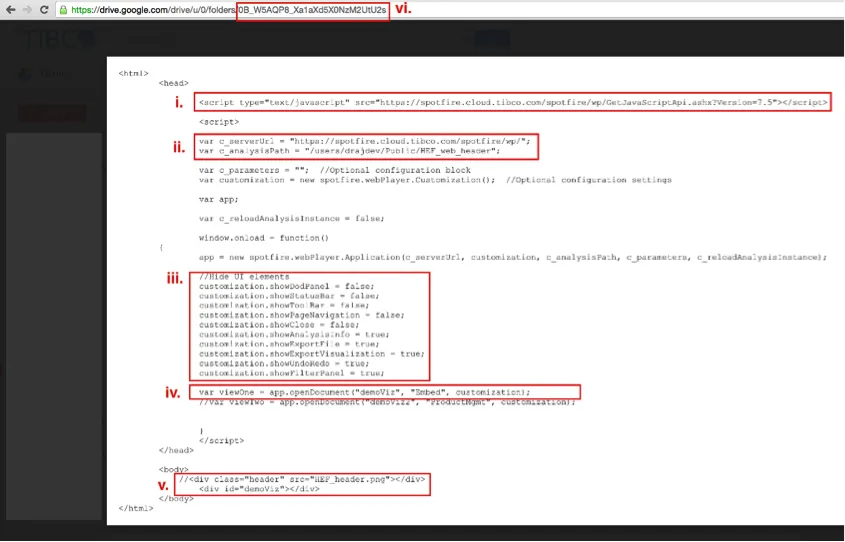
1. Include the path to Spotfire JavaScript API that enables you to access the visualizations and define the permissible functions to manipulate them
2. Define the server URL and URL of analysis path. Note that name of the analysis is appended to analysis path
Set up customization variables based on the amount of UI control you want to grant to a user on these visualizations on your webpage. The visualizations come in as an instance of the application defined immediately above this block of code
1. The views point the app to a <div> within the script that contains what you want to show on this web page
2. Define the level of embedding along with any formatting attributes like height and width. For simplicity, only the page level embedding has been shown here
3. Optionally, public access link
The above script would be supported as usual by CSS bundles and is ready to be dropped into your webhosting container. Additionally, options such as c_parameters, reloadApplicationInstance, and more documented can be used to set up configuration blocks, caching information, filter schemes on startup of the web page, and more. This set up brings the graphic power of Spotfire to your webpages, giving you more control of what you choose to show from analysis while reducing the hassle of recreating each visual using complex programmatic methods.
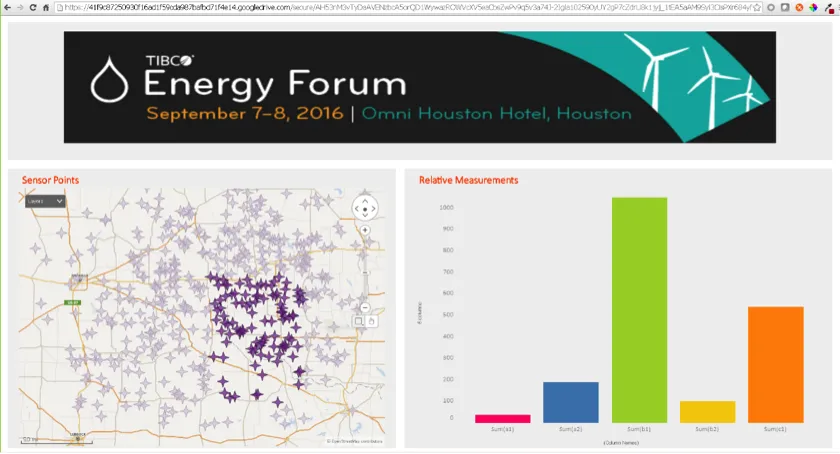
Pro-tip: If you do not have web hosting containers but would like to try out the above, simply save the html script in a public access Google Drive folder. Copy the part after …/folders/. This is the public access link. Point in the image above and access it using this link: http://googledrive.com/host/<publicAcessLink>.
Click here for a video walkthrough of the tutorial.