Spotfire Adds Features for Inline Data Preparation and Data Discovery
Blog: The Tibco Blog
This has been a very exciting week for us at TIBCO. On Monday, March 14, we launched Spotfire 7.5, and updated Spotfire Cloud. In this post, we will cover the incredible enhancements and additions that have been made to Spotfire.
Inline Data Preparation & Data Discovery
What is inline data preparation? One of the philosophies for Spotfire is that it should be easy for our customers to not only connect to different data sources, bring in all kinds of data, and perform data-mashups, but also to perform data preparation from within Spotfire. We want to minimize the inconvenience users encounter if they have to go outside the platform to prepare their data before doing visual analytics on it.
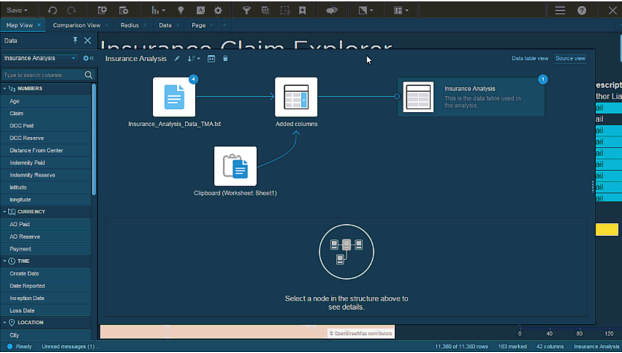
The data panel in Spotfire 7.5 has been enhanced to give the ability to see information about the data and easily make adjustments. Many data cleansing tasks can now be done from within the data panel. For example, the order of data values can be rearranged, new data columns can be generated, empty values can be filled, the date format can be changed, and data categorization can be corrected—all from within the data panel.
We have also introduced, for the first time, a data table source view in Spotfire Cloud. Data table sources and operations can now be easily viewed in a schema. This makes it possible to see detailed information about operations and preview results after intermediate steps.
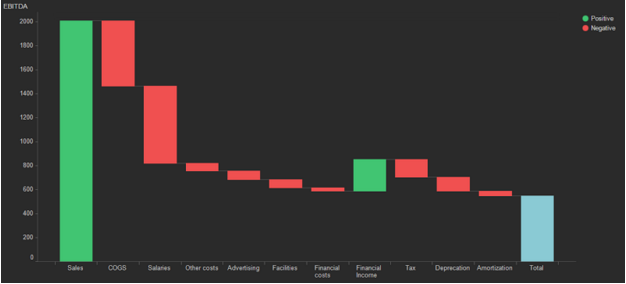
In the Spotfire cloud update, we have made numerous improvements to the visualizations. The most significant is the addition of a new visualization type—the waterfall chart. The waterfall chart is particularly useful for presenting how various categories contribute to a final result. If you want to get step-by-step instructions on making a waterfall chart in Spotfire, click here. You can also learn more about how to perform different types of analysis with waterfall charts by clicking here. In addition, we made it possible to add more details to the box plot, along with many other enhancements to the visualizations.
For further information on the latest Spotfire updates, please read the press release, view the video, or visit the Spotfire What’s New Page. Click here to try Spotfire for free.
Leave a Comment
You must be logged in to post a comment.