Shewhart Control Charts and Trend Charts with Limits Lines in TIBCO Spotfire
Blog: The Tibco Blog
Shewhart control charts are popular charts commonly used in statistical quality control for monitoring data from a business or industrial process. The goal of a statistical quality control program is to monitor, control, and reduce process variability. These charts often have three lines—a central line along with upper and lower control limits that are statistically derived. They enable the user to monitor a process for shifts, relative to a baseline historical period, that alter the location or variability of the measured statistic. There are a number of different types of charts, each with their own formula for calculating control limits and methods of applying rules to determine whether the process is in or out of control.
One common set of control charts consists of a pair of charts:
1. The individual chart which displays the individual measured values
2. The moving range chart which monitors the process variability.
Uses of control charts
—Monitor a process for special causes of variation that can occur. For example, a flood alarm that monitors water level.
—Control the location and variability of a process metric and not allow more process variation to occur than was present when the control limits were set. Often, a process capability study is performed prior to setting control limits, to ensure that the process is capable of performing within the specification limits. Specification limits define the region within which the metric must remain for proper functioning of the process or product.
—Drive continuous process improvement. Control charts identify out of control points, whose causes are identified and eliminated. Limits are then recalculated and tightened and the process is repeated.
Popular types of control charts
Run Chart
x̅ and S Chart
x̅ and R Chart
Individual and Moving Range Charts
p-, np-, c-, and u-charts
UWMA and EWMA Charts
CUSUM Charts
Levey-Jennings
Multivariate Control Charts
How to create control and trend charts with limits lines using Spotfire
Creating lines with lines and curves property
1. Control limits or specification limits may have predetermined values which can be set using the fixed value line option.
2. Predefined aggregated values can be used for creating lines like upper outer fence. The upper outer fence (UOF) is defined as the threshold located at Q3 + (3*IQR) where Q3 is third quartile and IQR stands for interquartile range
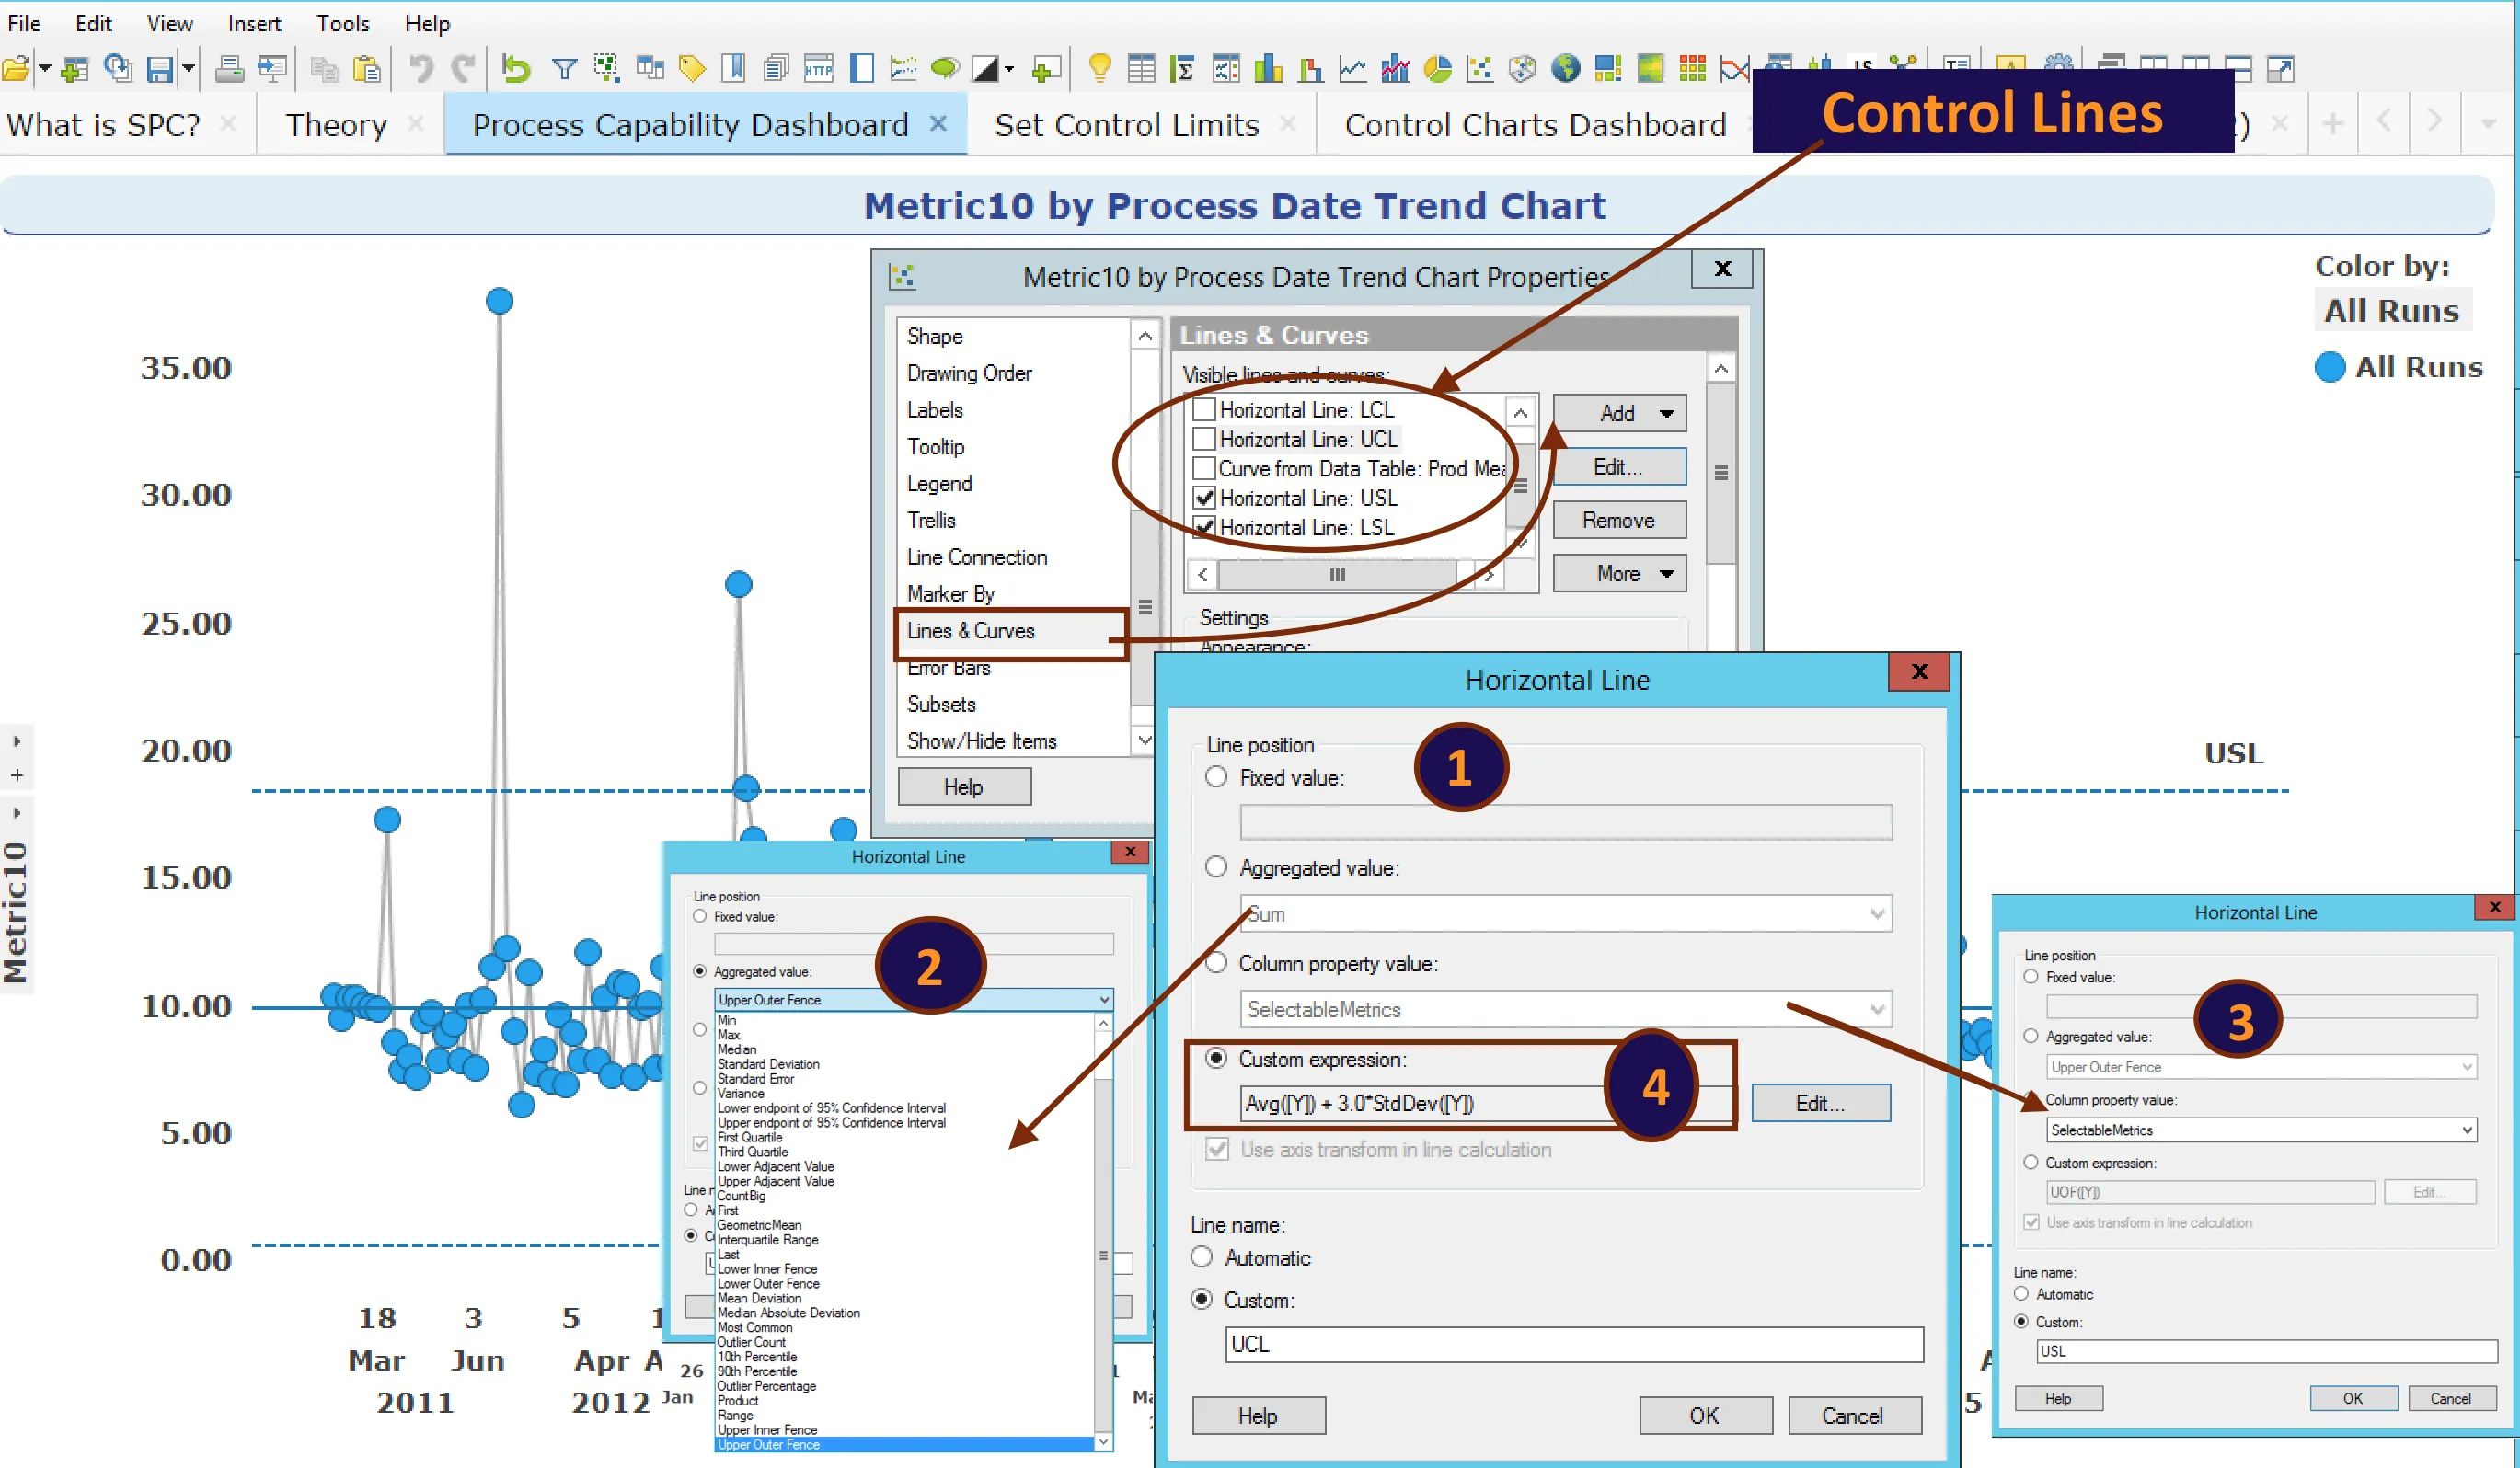
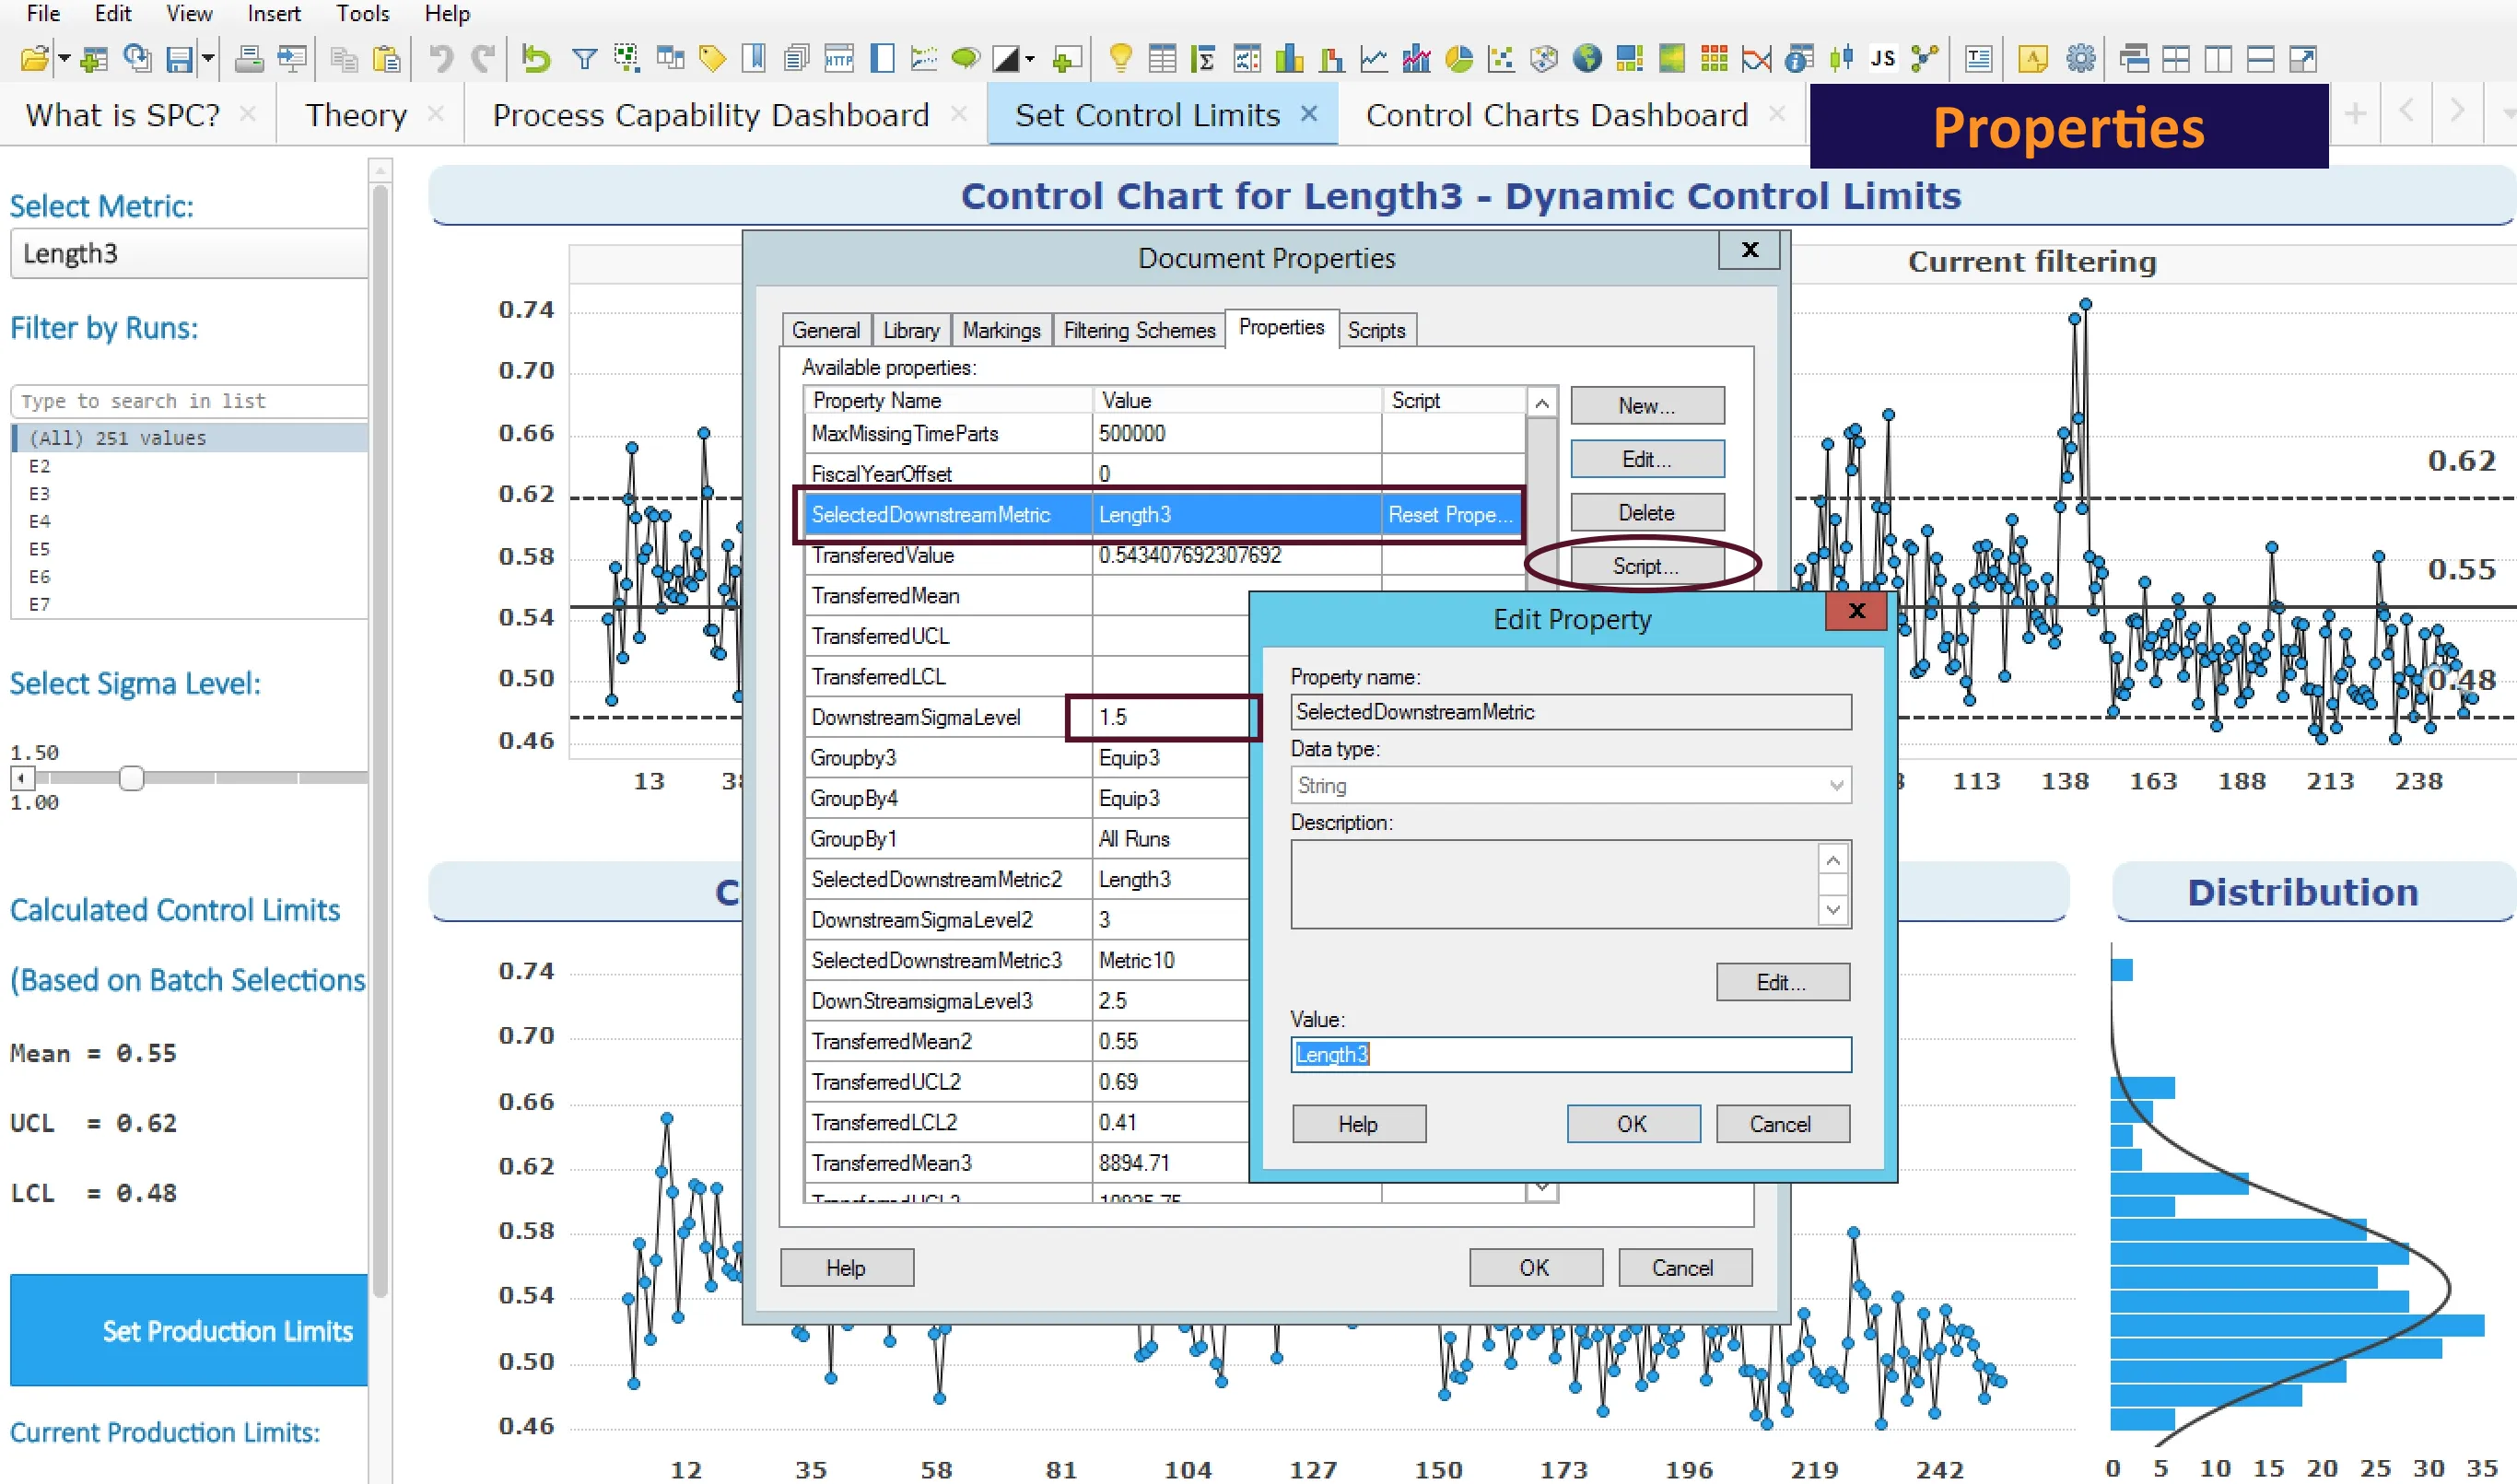
3. Property values can be used to specify dynamic control lines where it can be changed by a user, a script running in background, or a data function. Properties updates can be triggered by a user-friendly interface like selecting Sigma level and metrics.
4. Custom expressions, which can be easily modified, help create specific calculations for a control line. They can be as simple as Avg([Y]) + 3.0*StdDev([Y]). It can also be combined with properties.
Calculation-based lines
Sometimes, lines can a be complex equation: Y(Control Line) = C2 + (D/p) * cos [(p/D) * X + C1]
In this case, C1 and C2 are constants which can be properties in Spotfire, and D—which is drag in this equation—can be a column. Spotfire Math functions can be used to determine the cosine of the argument. The weight per length of line p can be another calculated column. In Spotfire, an expression may look like this where $ symbol indicates properties:
${RunYieldsTarget} +([Metric5]/[Metric6])*Cos([Metric5]/[Metric6]*[Metric1]+${Rpk.calculated})
Moving range chart
In order to create moving ranges, Spotfire LastPeriods OVER function is very useful. It includes the current node and the n – 1 previous node, which can be used to calculate moving averages.
Avg([Metric5]) OVER (LastNode([Axis.X,n]))/n
This function calculates n period average where n is an integer. If X-axis is defined as month, it will provide three month rolling average.
Control lines from another batch or process
Sometimes control lines can be from another golden batch or process.
Curve from another data table allows users to specify a custom curve expression, which makes use of parameters available in a specified data table or golden batch.
Line from column value can display lines based on X and Y coordinates that already exist in two columns of your analysis. For example, coordinate values could be calculated from the input data using a statistical calculation from a calculated column or even a data function, and the output result could be presented as coordinate values for a curve.
All these building blocks can be combined nested and morphed into a beautiful dashboard.

Try out Spotfire for yourself and see how easy it is to create insightful and beautiful dashboards from your data. Check out other Tips and Tricks blog posts to learn more.