Salesforce Dashboard – Creating Dashboard in Salesforce
Building Salesforce dashboards allows your marketing team to create compelling marketing campaigns and your sales team to understand the imported data in your Salesforce solution, gain more insights, and sell smarter.
What is Salesforce?
Salesforce is a well-known American cloud-based software company that offers CRM services. Salesforce is a popular CRM tool used by support, sales, and marketing teams all over the world.
Salesforce services enable businesses to better connect with partners, customers, and potential customers by leveraging cloud technology. Companies can use the Salesforce
Salesforce provides enough information for each Lead to allow your Sales Team to tailor their approach to each Lead. This increases your chances of success while also providing a personal touch to your clients.
CRM to track customer activity, market to customers, and provide a variety of other services.
A CRM platform allows you to go deeper into all of your metrics and data; you could also create a dashboard that visually displays your data. In addition, you can have personalized outreach through automation.
Check out this video for Salesforce Course
In this blog, we’ll look at the definition of a Salesforce dashboard, the various components required, and the process for building your own dashboard from scratch (in Lightning Experience).
Table of Contents:
- What is Salesforce Dashboard?
- Components in Salesforce Dashboard
- How to create a Dashboard in Salesforce
- Filter in Salesforce Dashboards
- Dynamic Dashboards in Salesforce
- Conclusion
What is Salesforce Dashboard?
A Salesforce Dashboard is a simple way to visualize key data from one or more Salesforce reports, and it can assist in “identifying trends, sorting out quantities, and measuring the impact of their activities.”
Dashboards are supported as a standard out-of-the-box Salesforce feature in both Salesforce Classic and Lightning Experience.
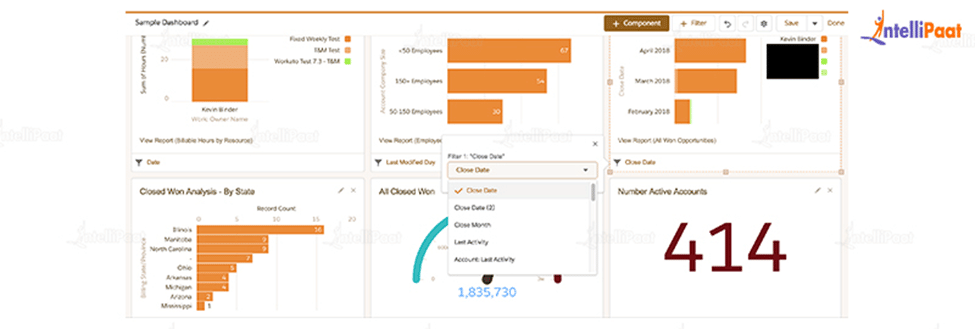
Dashboards offer more insights than reports because they combine data from multiple reports and display a summarised result. Looking at multiple reports at once allows you to quickly combine their results. Dashboard summaries also help us decide on action plans more quickly. Dashboards can include charts, graphs, and tabular data.
The time it takes for the dashboard to refresh depends on the available resources. Dashboard refreshes are processed in a queue because Salesforce is built on a multi-tenant structure. During off-peak hours, when more resources are available, the refresh tends to complete faster. Other factors, such as caching, can also have an impact on dashboard refresh times.
Learn more about the Salesforce tutorial
Components of Salesforce Dashboard
Dashboards are graphical representations of Reports in Salesforce. As a visual component, it displays data from source reports. These components provide a quick snapshot of the organization’s key metrics and performance indicators.
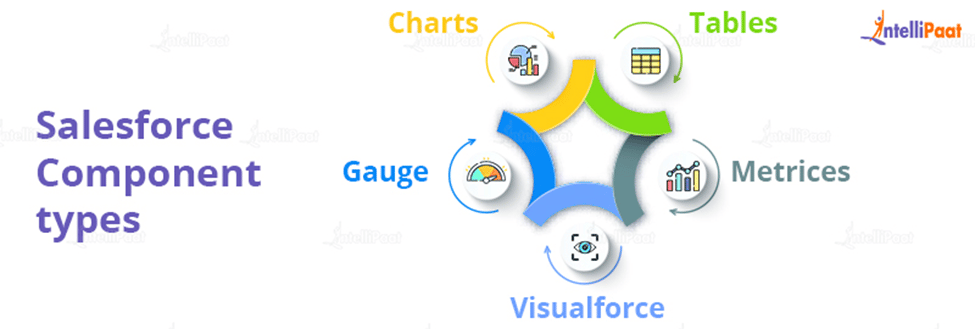
Salesforce Dashboard has 5 different types of components:
Charts:
Used to show comparisons. These are further divided into 6 types:
- Donut
- Funnel
- Pie
- Horizontal Bar Charts
- Vertical Bar Charts
- Line Chart
Tables:
Tables are used to display lists. As an example, consider the top five or bottom five possibilities.
Gauge:
A gauge is used to demonstrate progress toward a goal.
Metrics:
Metrics are used to display a single number, such as the total from a report, with a label.
Visualforce:
A Visualforce component is displayed as a dashboard using Visualforce. It is used to retrieve information from other data sources.
How to create a Dashboard in Salesforce
- Create a Source Report:
- You have to first create the source report that will be used in the dashboard
- Click the Reports tab, then New Report, and then choose a report type. Then Click the Continue button
- Click Filters and customize the standard filters to meet your needs
- You can group rows by clicking Outline
- You can then choose which columns to include in your report
- Click Save, name your report, and accept the unique name that was generated automatically
- Click Run to see how your report looks
- Creating a Dashboard:
You can now visualize your report using a dashboard component after you’ve created it
- You can access the Dashboard Builder directly from the Dashboards tab; simply click the New Dashboard button
- Then, give your dashboard a name, provide a description, and click Create.
- To add a component to your dashboard, go to the menu and select + Component. Click + Filter to add a filter
- A window will appear, and you must select the report you just created. Click the Select button
- Select your desired display from the Add Component menu. You can also include a subtitle
(Please keep in mind that each component displays data from a single report, and you cannot select joined reports or historical trend reports)
- When you have a single value that you want to show within a range of custom values, you can use a gauge.
- When you only need to display one key value, you can use a metric.
- A table can be used to display a set of report data in column form.
- Click Add, and then resize your dashboard component as needed by clicking it and dragging the corners and sides. then click Save
Congratulations! You have just finished your first Dashboard Creation
Wanna get Certified in Salesforce, here’s a golden opportunity for you Intellipaat Salesforce Course!
Courses you may like
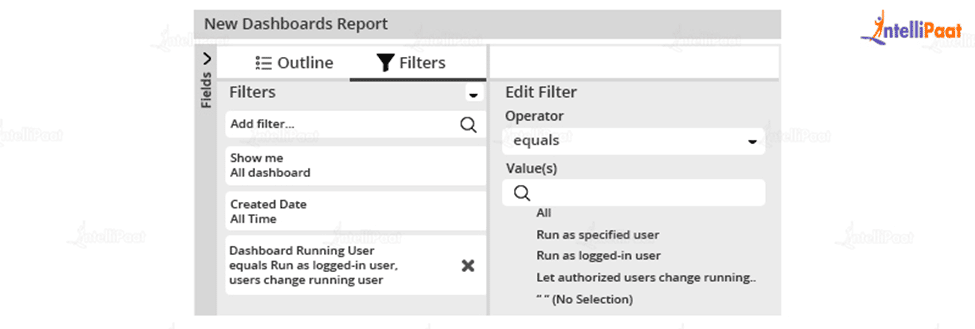
Filter in Salesforce Dashboards
Dashboard filters enable users to apply multiple data perspectives to a single dashboard. Domains from the dashboard’s source reports are relevant to filtering rules. Following the definition of filters, a user viewing the dashboard can select a filter to visualize the data of most interest. The filtered view is remembered, and the same filtered view is displayed the next time the user visits the dashboard.
Preparing for Salesforce Interview, here’s a Jackpot for you latest Salesforce Interview Questions in 2022
Dynamic Dashboards in Salesforce
Dynamic Dashboards, this feature allows you to select the running user of a dashboard; by default, this is the individual who created the dashboard, but it can be changed at any time.
Salesforce dashboards that are dynamic allow each user to see the data that they have access to based on their security and sharing settings.
Users can have up to 5 dynamic dashboards in Enterprise Edition, 10 in Unlimited and Performance Edition, and 3 in Developer Edition. Dynamic dashboards are not available in any of the other editions.
Conclusion:
The “Salesforce Dashboards” functionality out-of-the-box combines accessibility, ease of use, and capabilities, making it a widely used, near-ideal feature.
The ability to manage multiple Salesforce reporting modules is essential for both aspiring administrators and more senior trailblazers who are well into their journey. The reason is simple: as long as users work in Salesforce, they will almost certainly use at least one report, if not more!
your doubts get resolved in Salesforce Community!
The post Salesforce Dashboard – Creating Dashboard in Salesforce appeared first on Intellipaat Blog.
Blog: Intellipaat - Blog
Leave a Comment
You must be logged in to post a comment.