
Returning to Normal and Our Economy in the Time of COVID-19
Blog: The Tibco Blog
Reading Time: 5 minutes
As many countries and US states are in the beginning stages of reopening, COVID-19 cases continue to trend. After nearly three months of stringent social distancing efforts, some areas began to reopen at the end of May with the hope that the arrival of summer might mean the virus was slowing down. But while we are all eager to get the economy back on its feet and get back to our daily routines, the areas that have been the most liberal with reopenings are already experiencing a daily increase in new cases.

This poses an interesting challenge in terms of how best to mitigate the spread of disease while also restoring society and the economy. Data and analytics can help guide our community actions.
“The pandemic has highlighted the need for sound data science, visual analytics and data management methods, and the infusion of these skills and literacy into broader groups of users—in companies and the population at large,” says Michael O’Connell, TIBCO Chief Analytics Officer.
Data science and analytics have become a focal point for business leaders to find out what’s going on right now, how to best tune the business in this new order of demand and supply, and how to forecast what lies ahead.
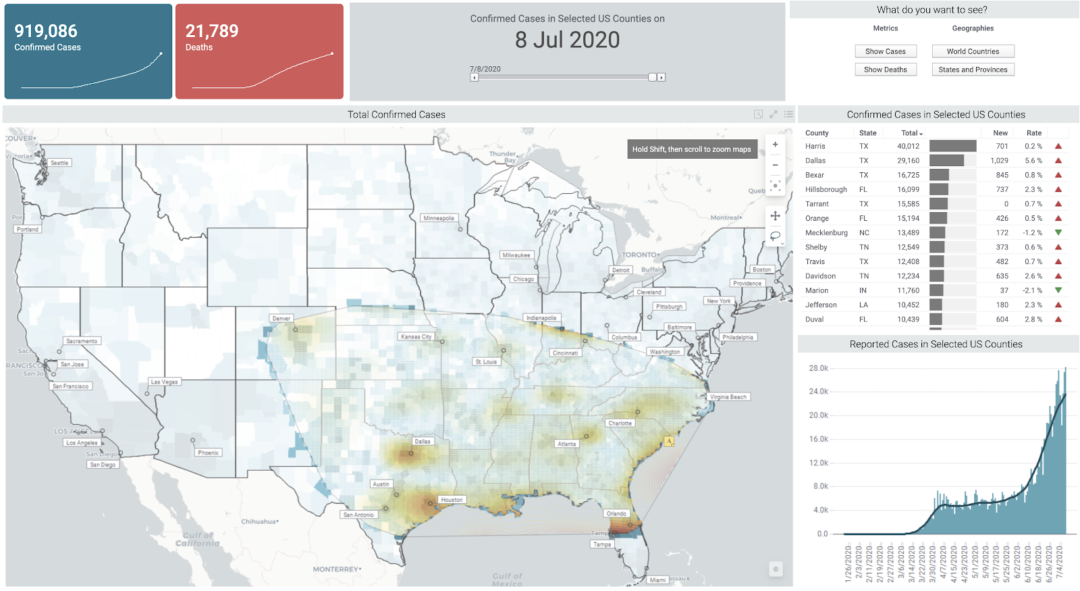
To this end, TIBCO has applied data science, visual analytics, and data management methods to a wide range of COVID-19 data, and this is available to the public via our COVID-19 Visual Analysis Hub. The Spotfire Live Report Application, uses data from 15 public sources that we ingest and refresh regularly. Some key components of the Live Report analysis are:
- Modeling the virus’ Reproduction number (Re/Rt). This provides insights into the virus spread, highlighting problem areas ahead of time.
- SuperSmoother analysis of the reported cases and fatalities. This removes inconsistencies and errors and provides summaries and projections of case velocities at local and regional levels.
- Analysis of testing and mobility data in context of business reopenings.
- Assessing the effects of local government interventions, with a collated dataset from local public health department sources, categorized to match prominent scientific papers and work from leading epidemiology institutions. These data are used to annotate case, fatality and hospitalization data, and the SuperSmoother estimates, to show the impact of local intervention efforts.
Our findings so far have provided clear evidence that social distancing interventions dramatically lowered the spread of local epidemics, and that the uptick in cases that have occurred over the past month is related to the relaxation of these efforts.
TIBCO’s COVID-19 Visual Analytics Hub has found that social distancing interventions dramatically lowered the spread of epidemics, and the uptick in cases over the past month is related to the relaxation of these efforts.
Click To Tweet
Helping Industries Better Understand COVID-19 Trends
The TIBCO Data Science team is collaborating with industry partners on specialized applications in the areas of healthcare, pharmaceutical, consumer goods, retail, and insurance and below, we examine some of these use cases.
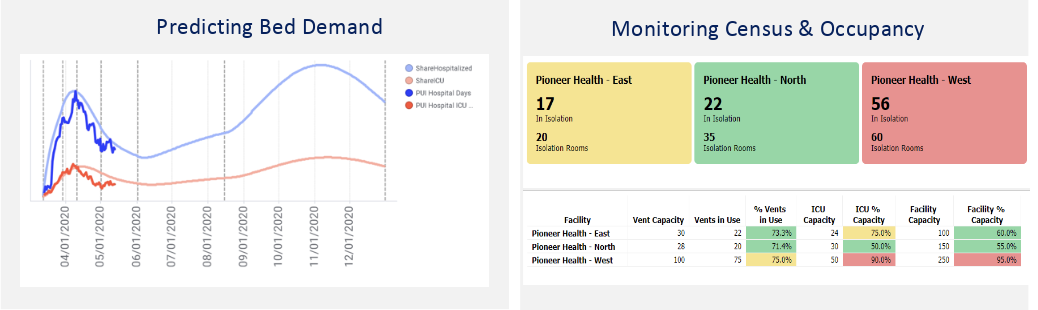
Syntellis is using TIBCO Spotfire with their hospital customers to track local hospital utilization rates, including beds, ICU beds, ventilators and equipment. Hospitals are updating these analyses, often in real-time, to ensure there are enough PPE for staff, enough beds for patients, and even to predict the number of beds expected to be available in the future. By looking at the trends in cases, along with the statistics on case severity and average stay, hospitals can anticipate bed availability beforehand.
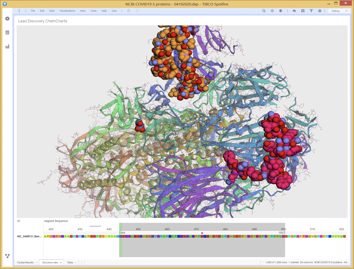
PerkinElmer is using Spotfire to study the bioinformatics and cheminformatics around the SARS-CoV-2 virus and treatments in development. They have studied 60,000 SAS-CoV-2 genome sequences and this community has tracked mutations that correlate with COVID-19 severity. Several studies are starting to elucidate the interplay between human genetics and COVID-19. SARS-CoV-2 is evolving rapidly—the original strain is almost gone and new strains are showing some different behaviors. Some recent results suggest that the O blood type may afford some protection. The Washington University (St. Louis) is also using Spotfire to study how human (host) genetic variation affects the virus’ ability to enter the cell and trigger immune response.
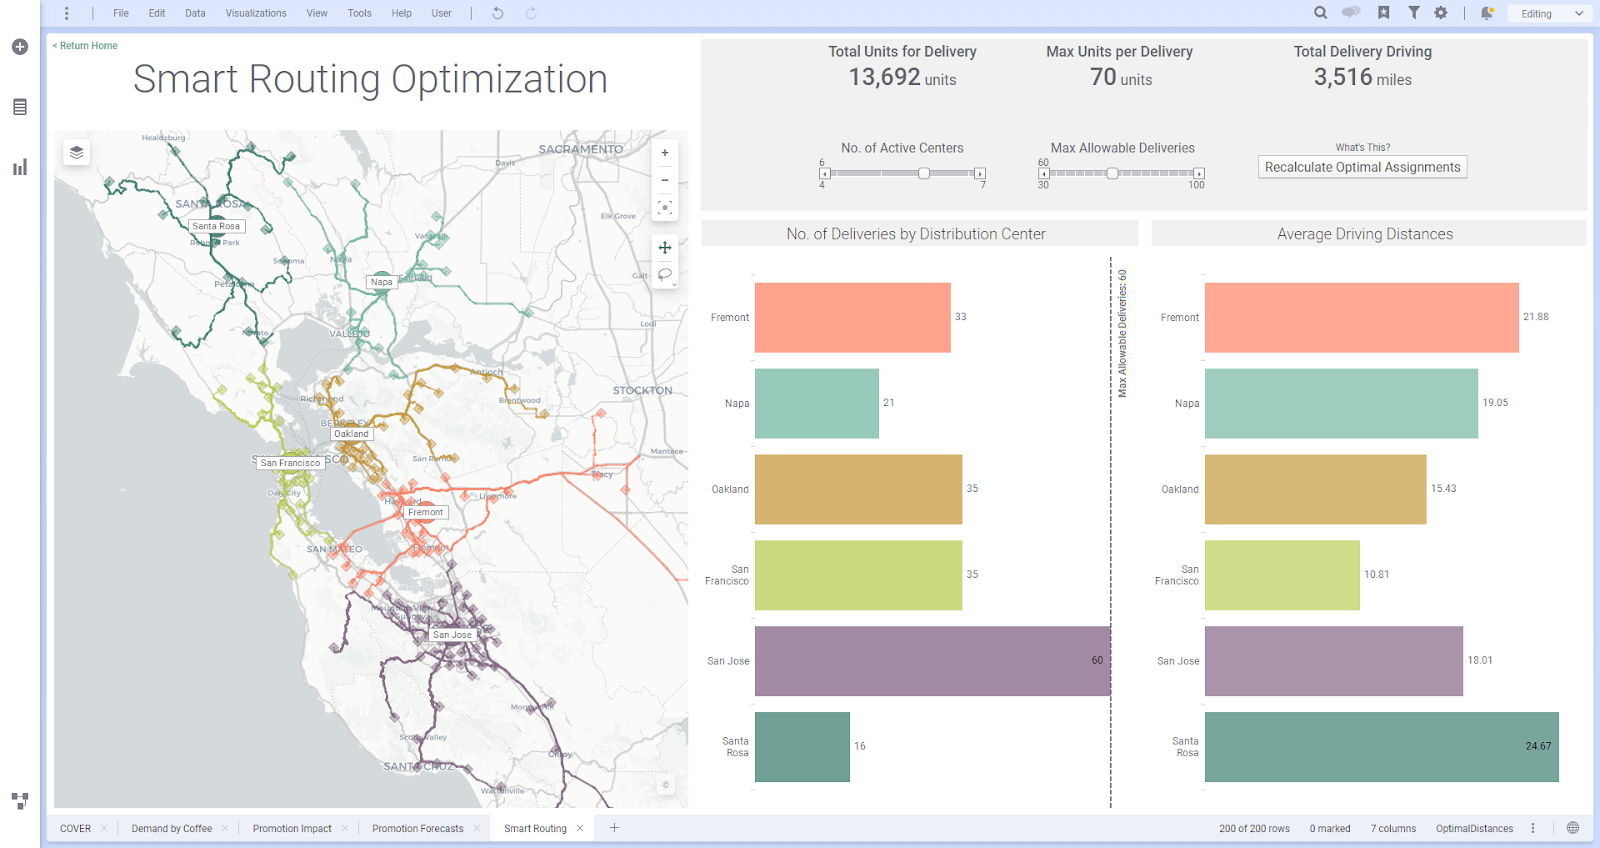
The consumer goods and retail industries are also relying on data science for insights into reopening. Forecasting and nearcasting demand and reconfiguration of supply chain and distribution is helping optimize patterns such as BOPIS (buy online, pickup in store). Data Science is also crucial in predicting revenues from eCommerce and stores as they reopen. Instore sales have been minimal, and traditional same store revenue forecasts have not been possible. It’s a new world and new methods of revenue generation and analysis are needed.
Using Data Science to Make Sure You Have a Safe Place to Work
But what does this mean for ‘reopening’? As we move forward, we will likely be continuing to focus on reducing transmission rates, including better hygiene practices—such as mask-wearing and hand washing—and increased testing rates, both for the virus as well as for antibodies.
We may be looking at a to-and-fro in virus cases; from local jurisdiction orders to reopen, along with people’s changing behavior and perceptions; followed by cycles of increased social distancing as fear of infection returns. To help ease the return to work, companies and government officials are turning to data science to help mitigate risks.
Technologies are emerging to help businesses reopen safely, such as the new TIBCO GathersmartTM offering. TIBCO GathersmartTM enables employers and schools to create surveys for employees and students that can be used to implement work from home or office policies, and to monitor and manage employees through a centralized dashboard. Leadership teams can visualize hotspots and evolve policy and response for personnel.
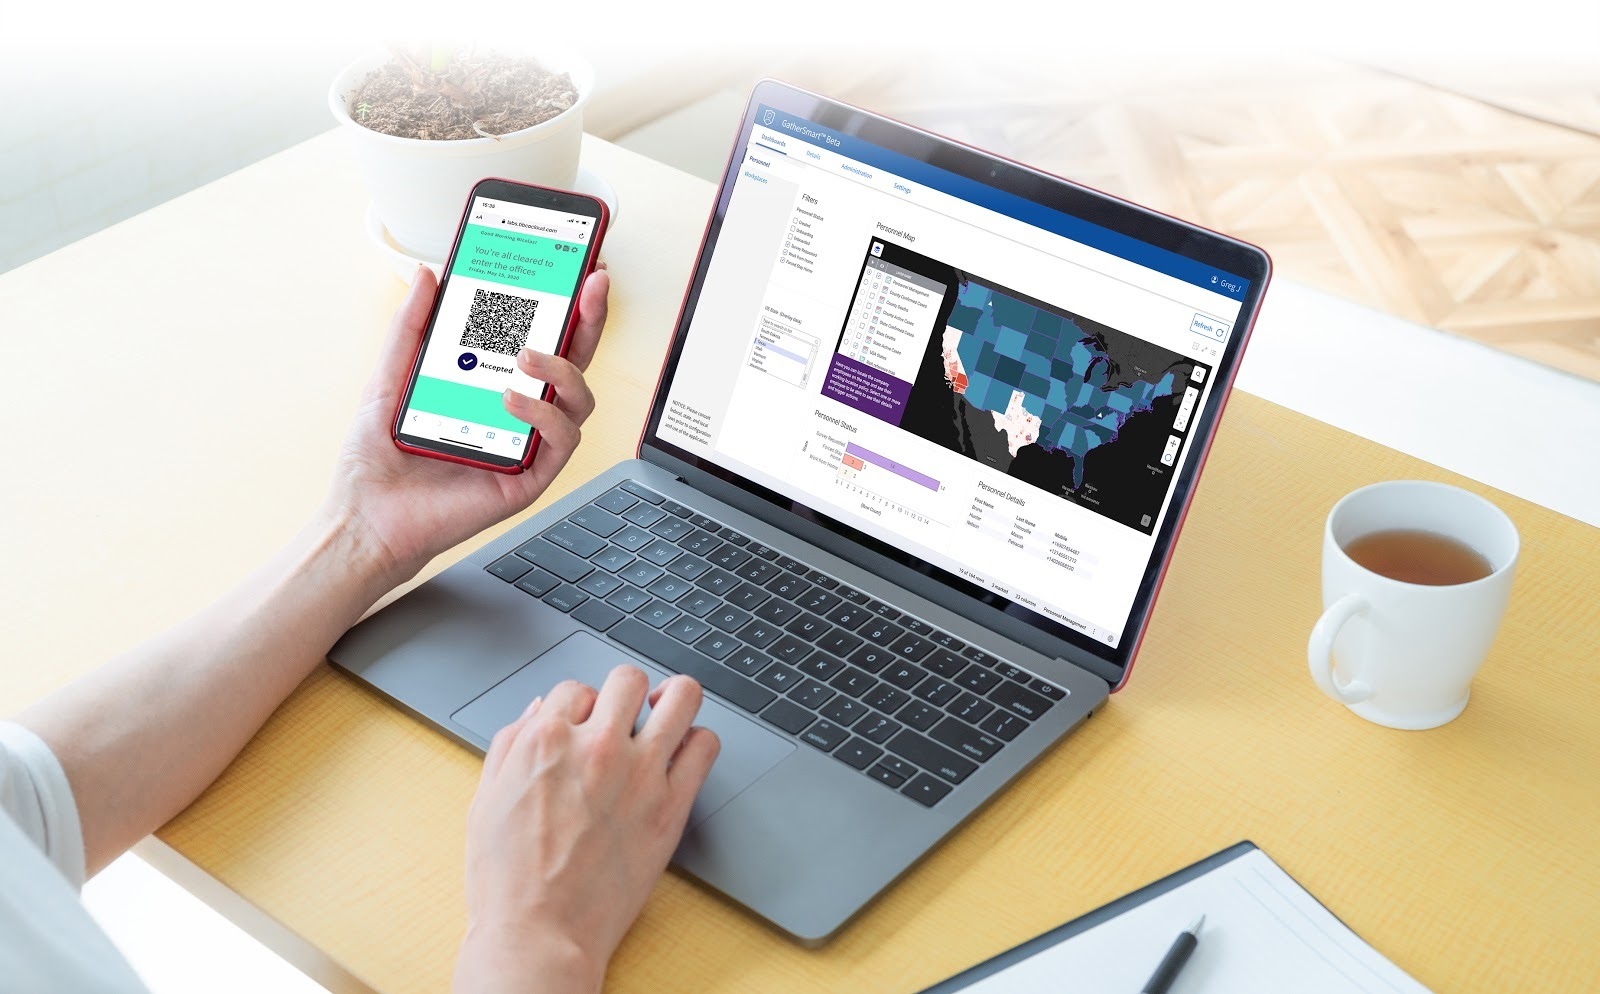
TIBCO GathersmartTM enables employers and schools to create surveys for employees and students that can be used to implement work from home or office policies, and to monitor and manage employees through a centralized dashboard.
Click To Tweet
For further insights into data science methods for pandemic analytics and reopening strategies from TIBCO’s Chief Analytics Officer Michael O’Connell and the TIBCO Data Science team, visit the COVID-19 Visual Analysis Hub and TIBCO Community blog. O’Connell and the team are hosting regular webinars where they discuss their most recent findings and explain the meaning behind the data science. To learn how we are addressing COVID-19 challenges from a data science perspective, watch the on-demand webinar today.
We hope you continue to stay safe and healthy as we move toward recovery.
Leave a Comment
You must be logged in to post a comment.