Re-documentation of SAP® ERP with Microsoft Visio®
Blog: BPM-Xchange team blog
SAP® offers leading enterprise resource planning (ERP) software for comprehensive support of enterprise business processes. Organizations require powerful ERP functionality for their implementation of custom business requirements and company compliance. All in all this leads to huge ERP implementations with sometimes confusing complexity. The governance of changes gets sometimes challenging for IT departments. More system transparency is the right way to gain understanding of dependencies and overcome communication gaps between business and IT teams. Microsoft® Visio® is the suitable tool to visualize ERP customizing and usage to match business requirements and company compliance for faster decisions.
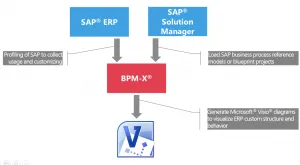
The BPM-X® approach utilizes adapters to connect SAP® ERP and SAP® Solution Manager (SSM) and to link with Microsoft Visio®. From SAP® ERP the customizing and usage of documents, transactions, reports and interfaces is loaded and mashed up with business process models from SSM process repository. SSM provides a SAP® best practice processes from the Business Process Repository (BPR). Those process maps that are very similar to famous process capability frameworks (PCF) such as APQC® or SCOR®.

Mash up ERP utilization and customizing with SAP Solution Manager blueprint process content
As the process structure so called Blueprint in SSM has a similar structure of a PCF we can map and load APQC® and SCOR® into the SAP blueprint process repository.
The SAP Blueprint is a simple structured map with process groups called scenarios, business processes and process-steps with assigned transactions and additional information such as Blueprint documents or test cases. BPM-X® fully exports and translates this tree structure to visual diagrams managed by tools such as Visio®. When ERP is profiled for usage and customizing, the visual process map can be accomplished by interacting SAP modules and applications, usage counters and customizing information such as Z-transactions, user roles and profiles.

Generate Process Maps from Blueprint Capability Maps
In addition to process map diagrams BPM-X® leverages Microsoft Reporting Services for use of business chart diagrams. E.g. charts can show the customizing landscape in the SAP ERP modules assigned to the number of customizing of more than 50 SAP customizing types.

Generate Business Charts from Usage and Customizing
The customizing hot spots can be quickly identified and further analyzed by drilling-down to the level of object modifications.
Miss-configuration or not used customizing can be identified and eliminated to lower the continuous testing and maintenance efforts. The generated process maps are a basis for re-documentation delivering an objective view to SAP® implemented and used processes. The visual documentation in Visio® is easy to read and the ideal basis for faster and sustainable decisions. As a result the change process is improved and faster realizations of change-requests are feasible. At the bottom line this leads to a more agile organization.