
Qatar World Cup Goals Statistics Dashboard
Blog: Drools & jBPM Blog
In Dashbuilder 0.26.0 we introduce Dark Mode, echarts as native library and global properties.
To showcase these features let’s explore a Qatar World Cup 2022 Goal Score dashboard!
FIFA World Cup Goals Statistics Dashboard
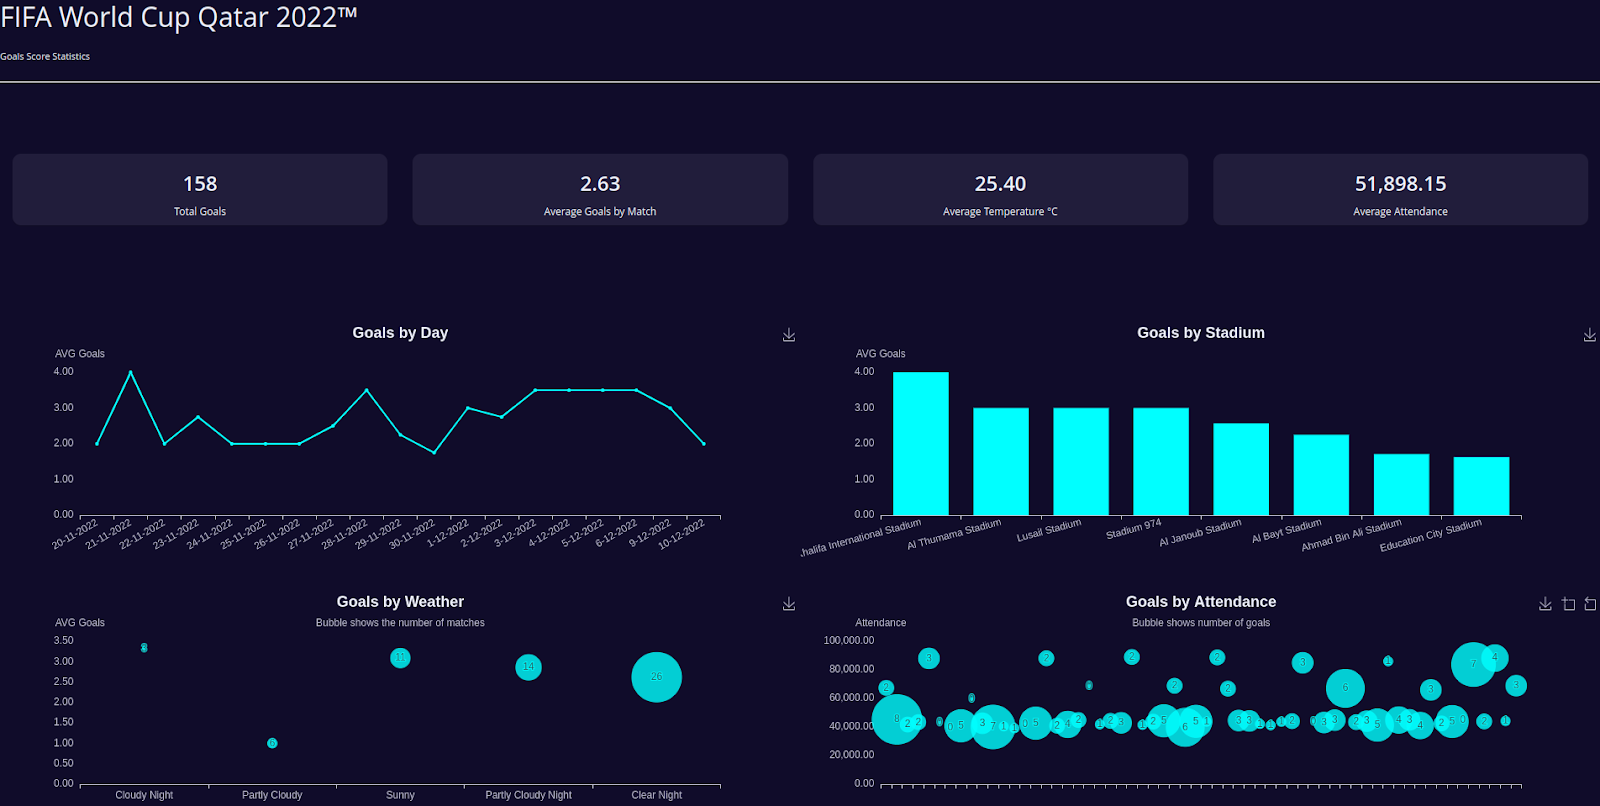
The dashboard shows a summary of goals and matches. The cards on top offer an overview of all matches, the 4 charts show different ways of seeing goals: by day, by stadium, weather and by attendance. At the bottom we have a table with all finished matches.
The data
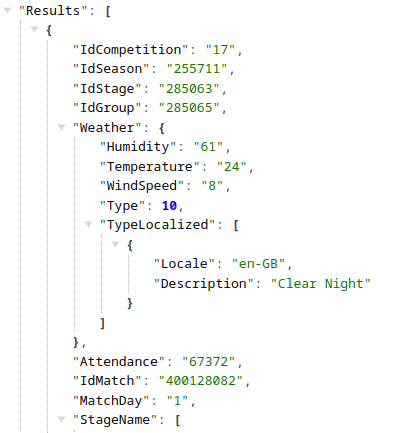
To build our dashboard we use FIFA REST API. Basically the following URL returns all matches for a given tournament on a given period of time:
https://api.fifa.com/api/v3/calendar/matches?from=2022-11-20T00%3A00%3A00Z&to=2022-12-20T23%3A59%3A59Z&language=en&count=500&idSeason=255711
This URL has a JSON response:
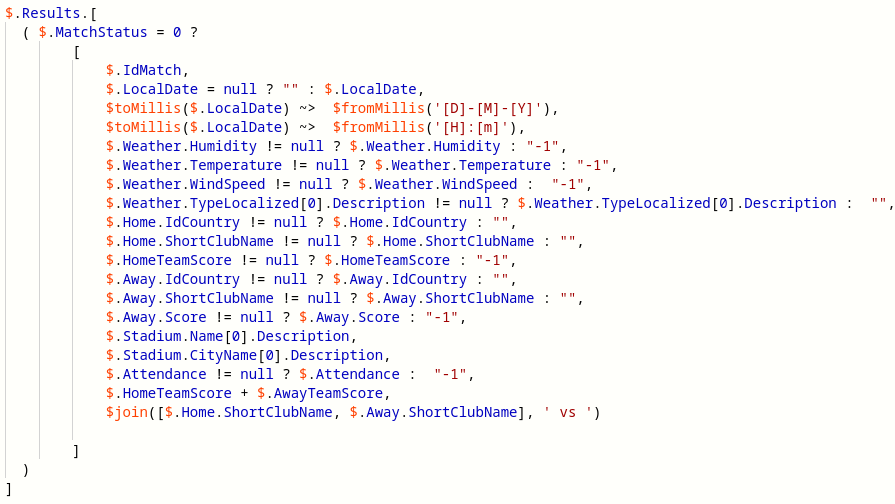
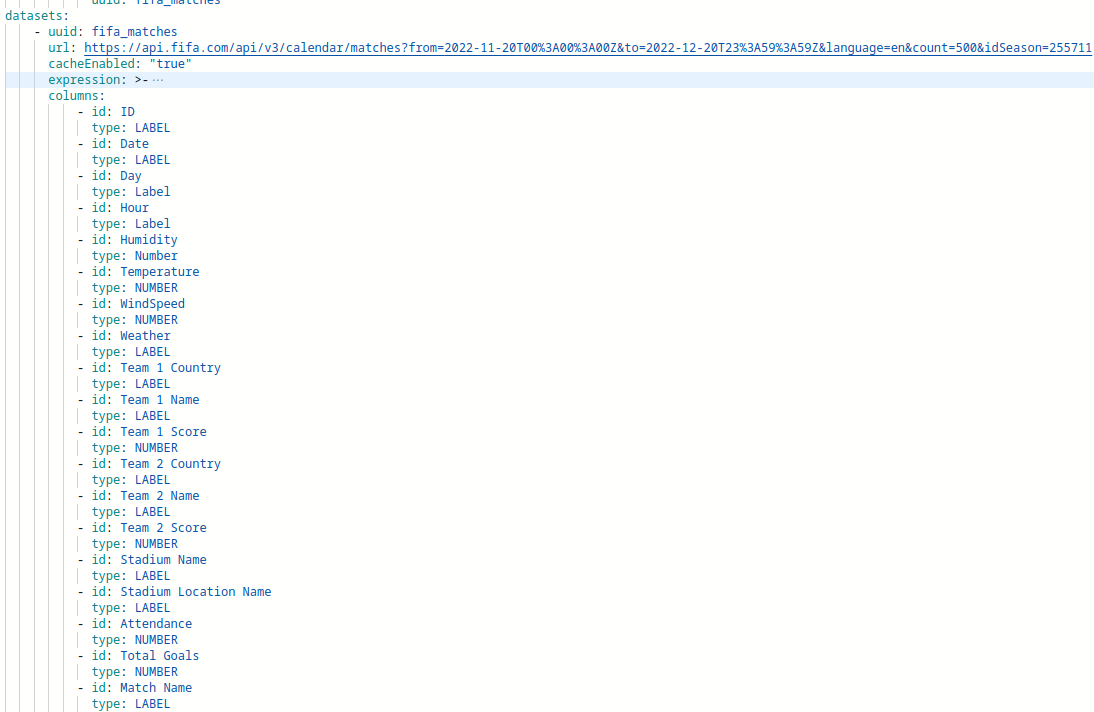
Once having the source of data we need to transform it to the format supported by Dashbuilder (a 2d JSON vector). For this we use a JSONAta expression, which simply select the fields we want and return in a JSON array format and also create a few fields:
Finally we can define our datasets in our YAML file and declare all columns that will be used in by the dashboards components:
Global Settings
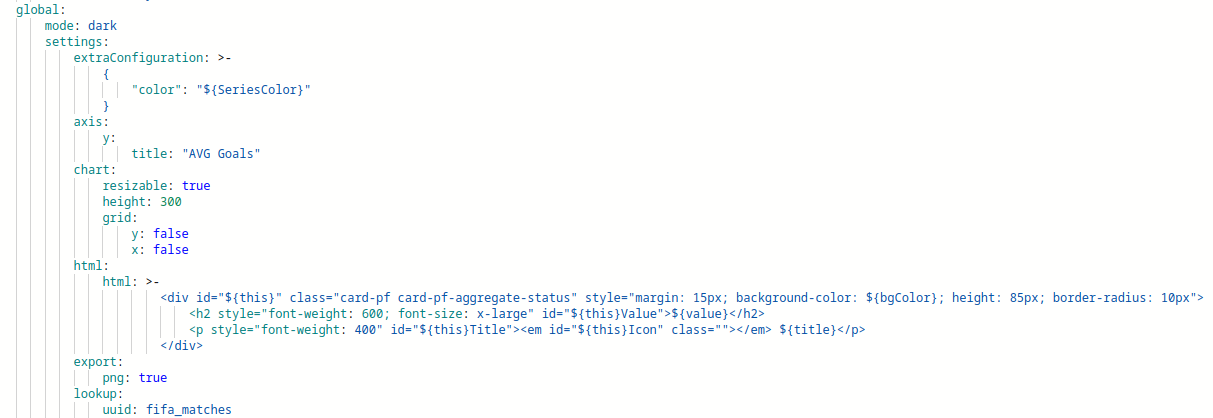
Our dashboards defines some settings that will be shared for all displayer element added to the page: all chart should use a specific color, y axis should have the same label, charts should be resizable, have the same height (300), grids are turned off, export the chart to PNG is enabled and they all consume the same dataset (fifa_matches). For cards (METRIC component) we define a common HTML template. Remember that these properties can be overridden by the component declaration!
Top Cards
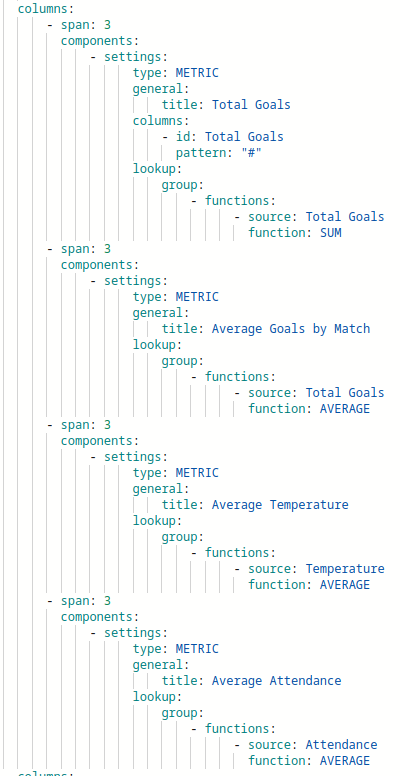
The top cards is a simply result of a dataset group operation:
- Total Goals: Sum “Total Goals”
- Average Goals by Match: Average operation o “Total Goals”
- Average Temperature: Average operation on “Temperature”
- Average Attendance: Average operation on “Attendance”
All the cards are organized in a row with four columns:
Charts
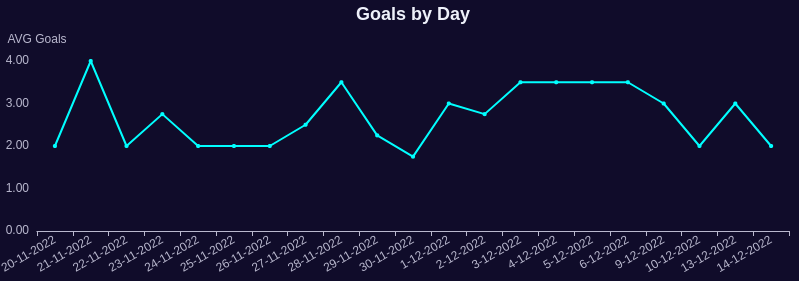
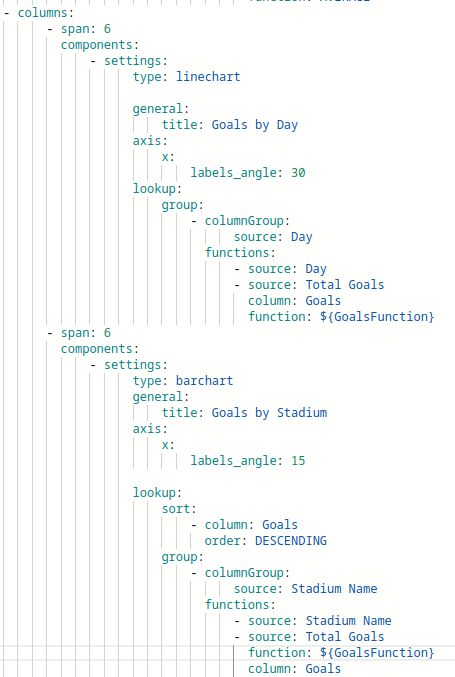
Charts are in two different rows. The first row contains chart “Goals by Day” line chart, which is match grouped by day, the resulting columns is the day and the average function on columns “Total Goals”
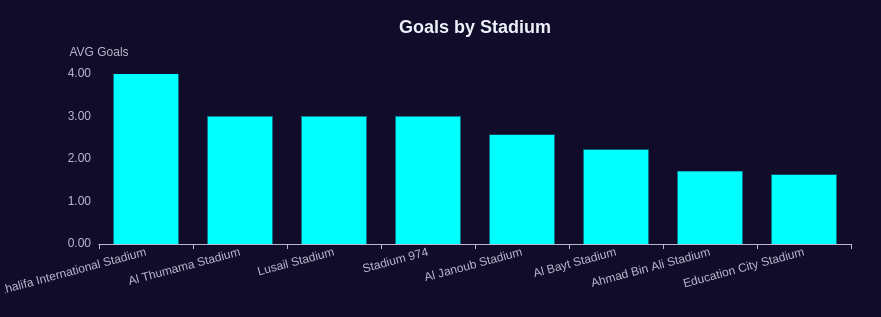
The second column contains a “Goals by Stadium” bar chart. It uses matches grouped by stadium and the column used on Y-Axis is also the average of Total goals
This is the first row code:
On the second row we have two bubble charts. “Goals by Weather” chart has weather on X axis, average number of goals on Y and the bubble size contains the total number of matches that happened on that weather
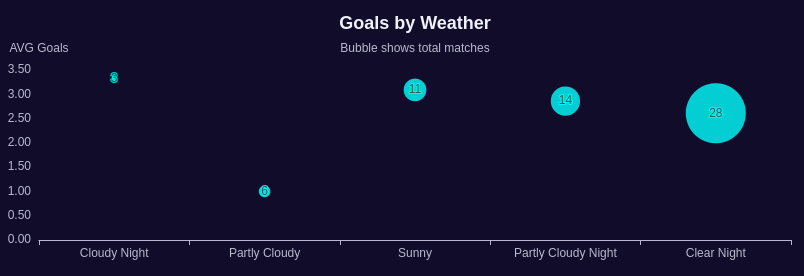
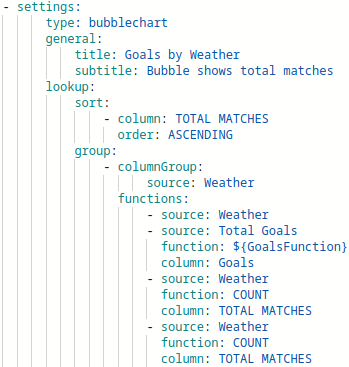
See for that we don’t declare the group function for the columns, instead we use a property that makes it easy to change the whole visualization. By default the group function is AVERAGE.
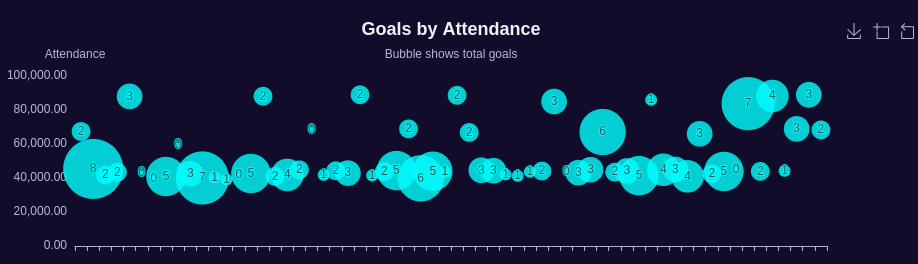
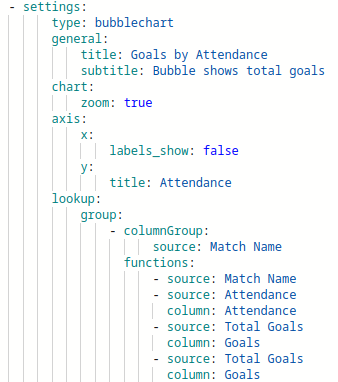
The “Goals by Attendance” chart does not use grouping, instead it shows all matches. The chart bubble size is relative to the match total goals, the x axis is the match name and the y axis is the attendance. Notice that this chart also has support to zoom!
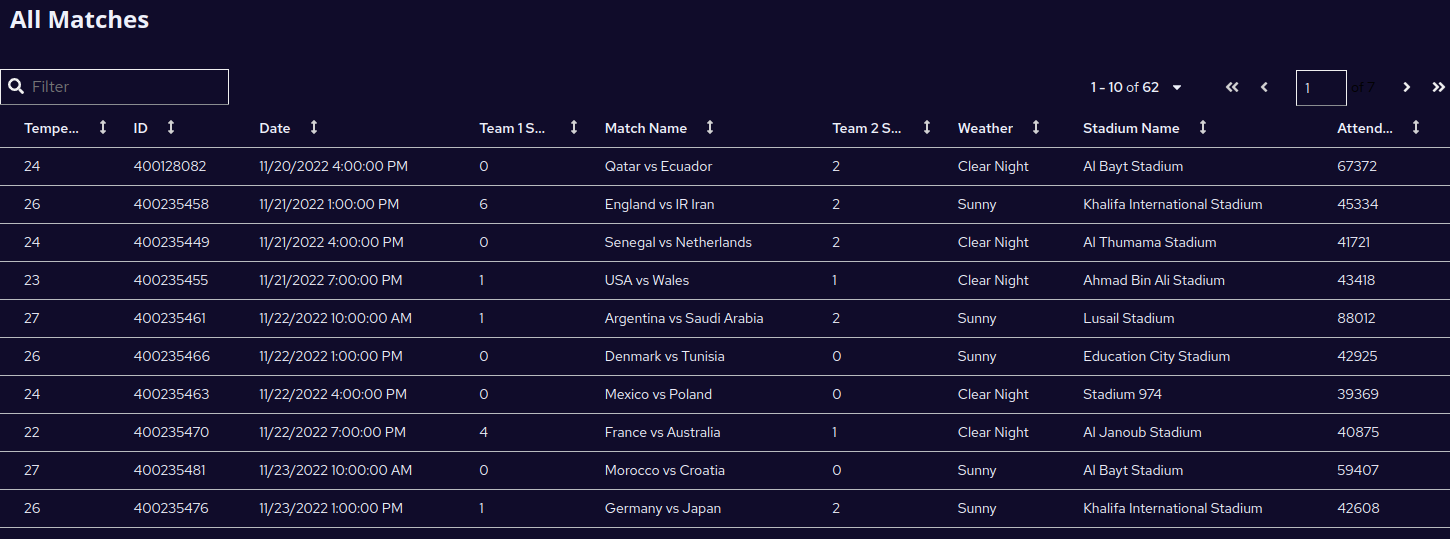
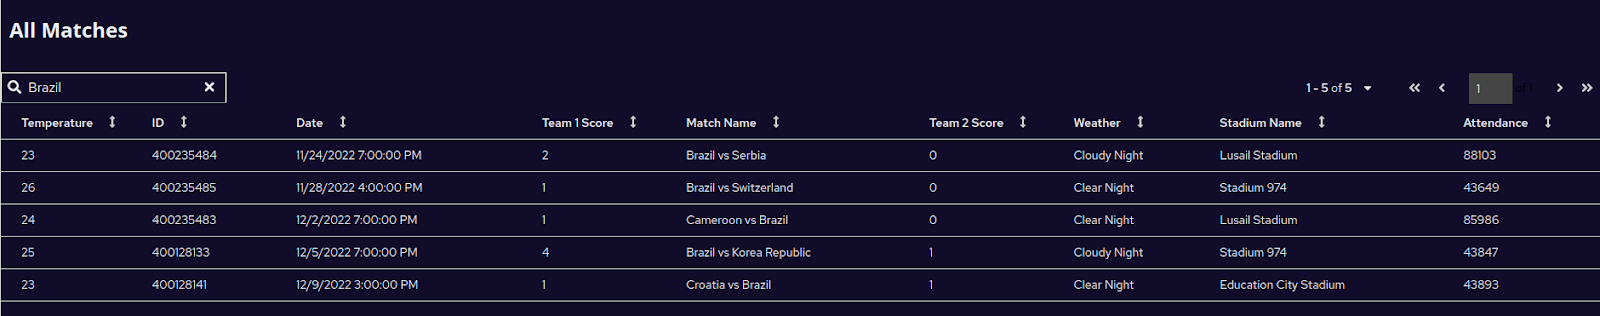
Matches Table
Finally we have a table showing all matches. It is not a native component, it is a micro frontend running outside of Dashbuider web bundle! Dashbuilder has a native table, but this external table component is great because it contains filters and order, but it loads all data in memory, so it is recommended to use it with datasets that have < 1k rows.
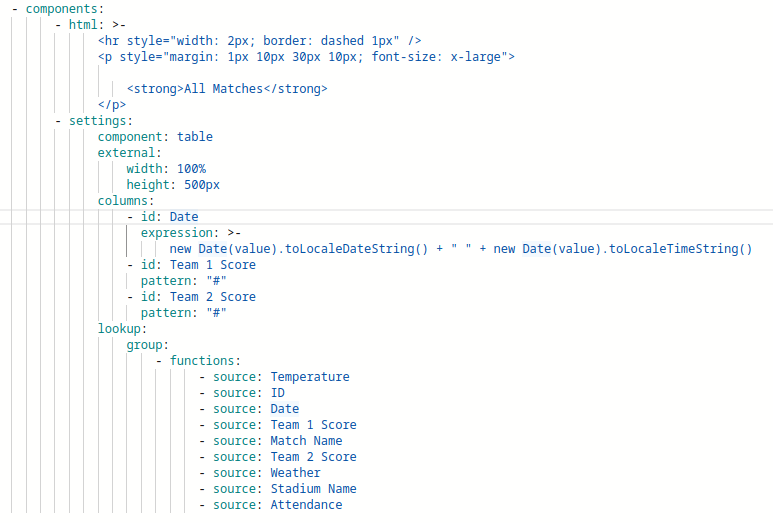
The data for the table does not have grouping, but we format the date. Any javascript could be used to format the data, but we decided to retrieve the day and hour using toLocaleData and toLocateHour. We also format score columns so they won’t show with decimal places.
The table is in its own row which has a single column with two components: the “All Matches” title and the table itself:
With this we cover the dashboard. Notice that we used most of the improvements that will be in the next Kogito Tooling release.
Dashbuilder 0.26.0 improvements
The version 0.26 has the following main features:
- Dark mode
- New native chart library: echarts
- Global settings for all displayers in the page
There are also new features for displayers:
- Mode dark can be applied to a specific displayer
- Under export users can define a boolean property png which allow users to
- Under general users can define allowEdit property so a new button will show a popup with the data displayed in a chart
- Also under general users can define a new subTitle for charts.
- A new field extraConfiguration allows users to pass a JSON with ECharts Option that will be merged with the displayer options.
- Users can now determine the maximum and minimum bubble size in Bubble using properties minBubbleSize and maxBubbleSize under bubble
At the time of this writing the 0.26.0 version is not released yet, keep an eye on our blog to see when it is released. If you want to try this version use the Serverless Logic Web Tools nightly build!
Conclusion
In this article we shared a new dashboard built with the 0.26.0 Dashbuilder version. Check the full code in our samples repository.
We are preparing a great news story that involves Dashbuilder and Quarkus, so stay tuned!
The post Qatar World Cup Goals Statistics Dashboard appeared first on KIE Community.