Profiling to improve DMN file’s loading time
Blog: Drools & jBPM Blog
One of my passions is to run profiling tools to find places in the code where performance improvements can be made. Sometimes, we are strongly convinced to know where bottlenecks are, and then, after running a profiler, find out that something completely different is making everything slow. This is one of those cases.
In this article, I’ll show you how to profile a GWT application, the DMN Editor.
What is profiling?
In a nutshell: it is to run a tool against your running application that takes “snapshots” of what is being processed in terms of CPU, memory, I/O, and so on and at the end compare all the “snapshots” to see what it is being shown most of the time in those “snapshots”.
Free pro-tip running any profiling tool
Sometimes the entire process that you want to analyze takes too much time, like minutes or even hours. You don’t need to run the profile for all that time otherwise you’ll produce an amount of data so big that analyzing that will be another problem. Of course, if the process takes, for example, 3 minutes but the first minute is slow because of one cause and the remaining minutes are slow because of another thing, a good strategy is to run the profile more times choosing the specific frame time that you want to analyze.
What tool do I use?
For this scenario, which is to profile a GWT application, I use the Firefox Profiling Tool available in the Firefox Developer edition. Keep in mind that the tool choice depends on your programming language, where are you running your application (desktop, web), and so on
The real case
In this scenario, we have a very large DMN model that was taking almost 4 minutes to load. And after being loaded, it still doesn’t seem that it was loaded like there is something that is still running in the background causing browser slowness and sometimes making it crash. To start I decided to analyze only the first 30 seconds to see if I got any clue there.
Running the profiling tool
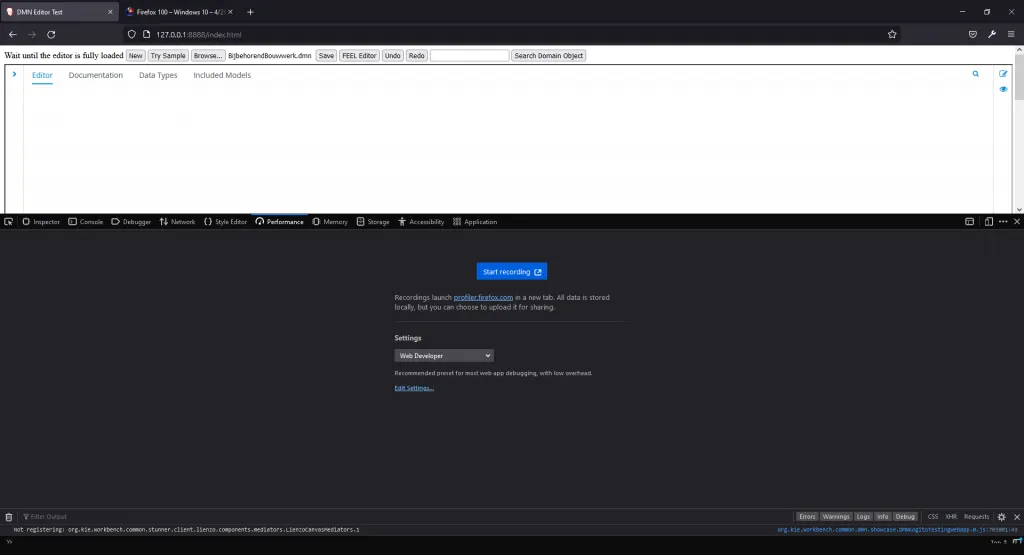
All set, it’s time to run the DMN Editor for the first time!
In the Firefox Developer, I hit F12 to show the developer tools.
Then I go to the “Performance” tab.
Finally, I started the loading of the DMN model which was taking too much time to load.
I clicked on “Start recording” and waited a few seconds….

Clicked on “Capture record”.

Firefox then loaded my data to profiler.firefox.com, and show me the results with the hot path expanded:

Everything is clear now! The method _Kv_g being called by JcG_g called by sjm_g was my bottleneck!
Wait… wait… what???
Profiling GWT
A part of our code is written in GWT. For those not aware: the code is written in Java and then “transpiled” to JavaScript. In other words, the code written in Java is “translated” to pure JavaScript code. But obfuscated (not readable by human beings).
To debug we use a source map which is handled by the browser. Source map, as its names suggest, it is a “map” that tells the debugger what/where is the real code of the running code. So the method _Kv_g that we saw before is shown in the debugger like executeMyHappyMethod(). Or something like that.
But unfortunately, it seems it doesn’t work for profiling. All we saw is the obfuscated code.
But don’t panic. You just need to rebuild your application by changing the GWT transpiler from its default “generate obfuscated code” to “generate pretty code”. There are many ways to do that, it depends on the structure of your project but at the end of the day you just need to pass the parameter “-style PRETTY” to the GWT transpiler. In the case of our project, I had to change the pom.xml files to something like that:
<plugin>
  <groupId>org.codehaus.mojo</groupId>
  <artifactId>gwt-maven-plugin</artifactId>
  <configuration>
  <style>PRETTY</style>
(…) the rest of the settings
Now everything is ready for a proper profiling phase. In the next post of this series, I finally show how we reduced the loading time of a file from around 3:53 minutes to 33 seconds with a simple change! Stay tuned!
The post Profiling to improve DMN file’s loading time appeared first on KIE Community.