
Profiling and optimizing executable model generation
Blog: Drools & jBPM Blog
Introducing Drools executable model
During the development of Drools 7.x we created the executable model with the goal of providing a pure Java-based representation of a rule set. One of the main drives for its introduction was to speed up the creation of a KieContainer starting from a compiled kjar.
In fact what Drools 6.x did during the kjar compilation and packaging was simply to parse and verify the drl files and other Drools related assets. After this validation it put those files unchanged into the kjar. This implies that when the kjar was installed into a KieContainer, Drools had to reparse those files from scratch, resulting in quite a long time required to create a KieContainer, especially for large rule bases.
What the executable model does to solve this problem is replacing, at kjar creation time, the rules written in drl like for instance the following
rule "Sum ages of Persons starting with M" when
accumulate ( $p: Person ( name.startsWith("M") );
$sum : sum($p.getAge()) )
then
insert(new Result($sum));
end
with a purely Java-based representation of the same rule like
Variable var_$p = D.declarationOf(Person.class, "$p");
Variable varage = D.declarationOf(Integer.class);
Variable var$sum = D.declarationOf(Integer.class, "$sum");
Rule rule = D.rule("Sum ages of Persons starting with M")
.build(
D.accumulate(D.pattern(var_$p)
.bind(var_age, (Person this) -> _this.getAge())
.expr((Person _this) -> _this.getName().startsWith("M"), D.reactOn("name")),D.accFunction(IntegerSumAccumulateFunction::new, varage).as(var$sum)),
D.on(var_$sum).execute((Drools drools, Integer $sum) -> {
drools.insert(new Result($sum));
}));
This Java representation, invoking an ad-hoc created DSL, is (in its current state but we also planned to work on this) probably too complex and too low level. It would be very hard for a Drools user without a deep understanding of the engine internals to write it correctly. However it can be automatically generated like the kie-maven-plugin does. In this way in Drools 7.x, when the kjar is installed into a KieContainer, executing the DSL to interpret it is enough to instantiate the phreak network. That’s the meaning of the term "executable model".
Externalizing executable model’s lambda expressions
Using this executable model not only dramatically reduced (even more than 90%) the time required to create a KieContainer, but also allowed runtime improvements. In fact the predicates in the executable model are lambdas and are used to evaluate conditions inside the phreak network nodes in a much faster and cleaner way than interpreting those constraints via MVEL (and eventually transforming it into bytecode via ASM after a few iterations) as it did before.
Unfortunately we also found that this strategy had a major drawback for what regards memory occupation. In fact the lambdas are referred inside the phreak nodes but in turn they keep a reference to all the intermediate data structures used to interpret the model and to create the phreak network. In essence those data structures are no longer useful once the phreak network has been instantiated, but the lambda expressions keep them alive and then the garbage collector cannot reclaim the memory space that they occupy.
We addressed this issue adding a second stage in the executable model generation process that rewrites all those lambdas transforming them into external classes. After this rework the generated executable model for the former rules now looks like this
Rule rule = D.rule("Sum ages of Persons starting with M")
.build(
       D.accumulate(D.pattern(var_$p)
        .bind(var_age, LambdaExtractor1.INSTANCE)
        .expr(LambdaPredicate2.INSTANCE,
      D.reactOn("name")),
      D.accFunction(IntegerSumAccumulateFunction::new, varage)
       .as(var$sum)),
      D.on(var_$sum).execute(LambdaConsequence3.INSTANCE));
@MaterializedLambda
public enum LambdaExtractor1 implements Function1 {
INSTANCE;
public Integer apply(Person _this) {
return _this.getAge();
}
}@MaterializedLambda
public enum LambdaPredicate2 implements Predicate1 {
INSTANCE;
public boolean test(Person _this) {
return _this.getName().startsWith("M");
}
}@MaterializedLambda
public enum LambdaConsequence3 implements Block2 {
INSTANCE;
public void execute(Drools drools, Integer $sum) {
drools.insert(new Result($sum));
}
}In this way the lambda expressions no longer hold a reference to the rest of the executable model that now can be successfully garbage collected once its duty is terminated.
Improving compile time performances
To recap, the introduction of the executable model allowed both a very fast KieContainer creation and some improvements and simplification of the runtime with the possibility of getting rid of mvel and ASM.
The last drawback of this is in the fact that we considerably increased the time required by the kie-maven-plugin to produce a kjar out of a rule base: translating each rule and generating the corresponding executable model Java source code is a time consuming task and the lambda externalization post-processing phase made this even longer.
In order to at least mitigate this problem and also speed up the generation of the executable model we decided to take two complementary approaches. First we figured out that the whole executable model generation process was unnecessarily sequential and that we could better leverage our shiny multicore CPUs parallelizing it in 2 different points. Since version 7.55 instead of translating each rule into the corresponding executable model one after the other we do this in parallel performing this translation inside the Fork/Join thread pool of a parallel Stream. In a very similar way we have been also able to parallelize the externalization of the lambda expressions with the only precaution of avoiding the concurrent modification of the AST generated by JavaParser, the tool that we used to programmatically generate the source code of the executable model.
Second, we also tried to figure out if there was the possibility of improving the performances of our executable model generator regardless of its internal parallelization. Trying to guess where a Java program consumes the biggest part of time and resources is nearly impossible. The only way to do this correctly is measuring and using the right tools. First of all we created a JMH benchmark that compiles a real-world project containing more than 2,000 rules provided by a customer, who has been also one of the early adopters of the executable model, and obfuscated accordingly. We used it both to profile the executable model generator and of course to check how effective our improvements are.
To profile our benchmark we used async-profiler that has the advantages of being seamlessly integrated with JMH, having an extremely low overhead and producing effective and easy to read flamegraphs. To make async-profiler generating the flamegraphs profiling the benchmark under execution is sufficient to add to the command line used to launch JMH a -prof argument like the following:
-prof "async:output=flamegraph;event=cpu;simple=true;dir=/tmp/Profile;width=1920;libPath=/home/mario/software/async-profiler-1.8.1-linux-x64/build/libasyncProfiler.so"
where
- async is to use async-profiler as profiling tool. There are other profilers available like perfc2c.
- event is the feature under profiling: cpu (the default) is to find the most time-consuming method. You can also use alloc to check the memory allocation, cache-misses and others.
- output is indeed the format used to produce the profiling results. The supported ones are text, collapsed, flamegraph, tree, jfr (default is text) but in general I find flamegraphs very visual and then easy to read.
- simple=true is to print only the simple class names instead of the fully qualified ones. Having the complete package names in the flamegraph make it much harder to read
- dir is the directory where the output will be written
- width is the width in pixels of the flamegraph, the bigger the better 🙂
- libPath is the location where you have downloaded the async-profiler library
Profiling the executable model generation
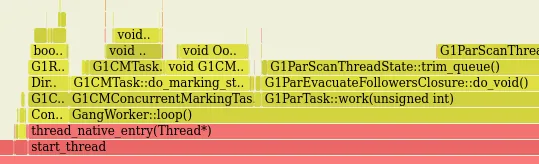
With this setup, a first run to our benchmark revealed a quite unexpected but very evident issue
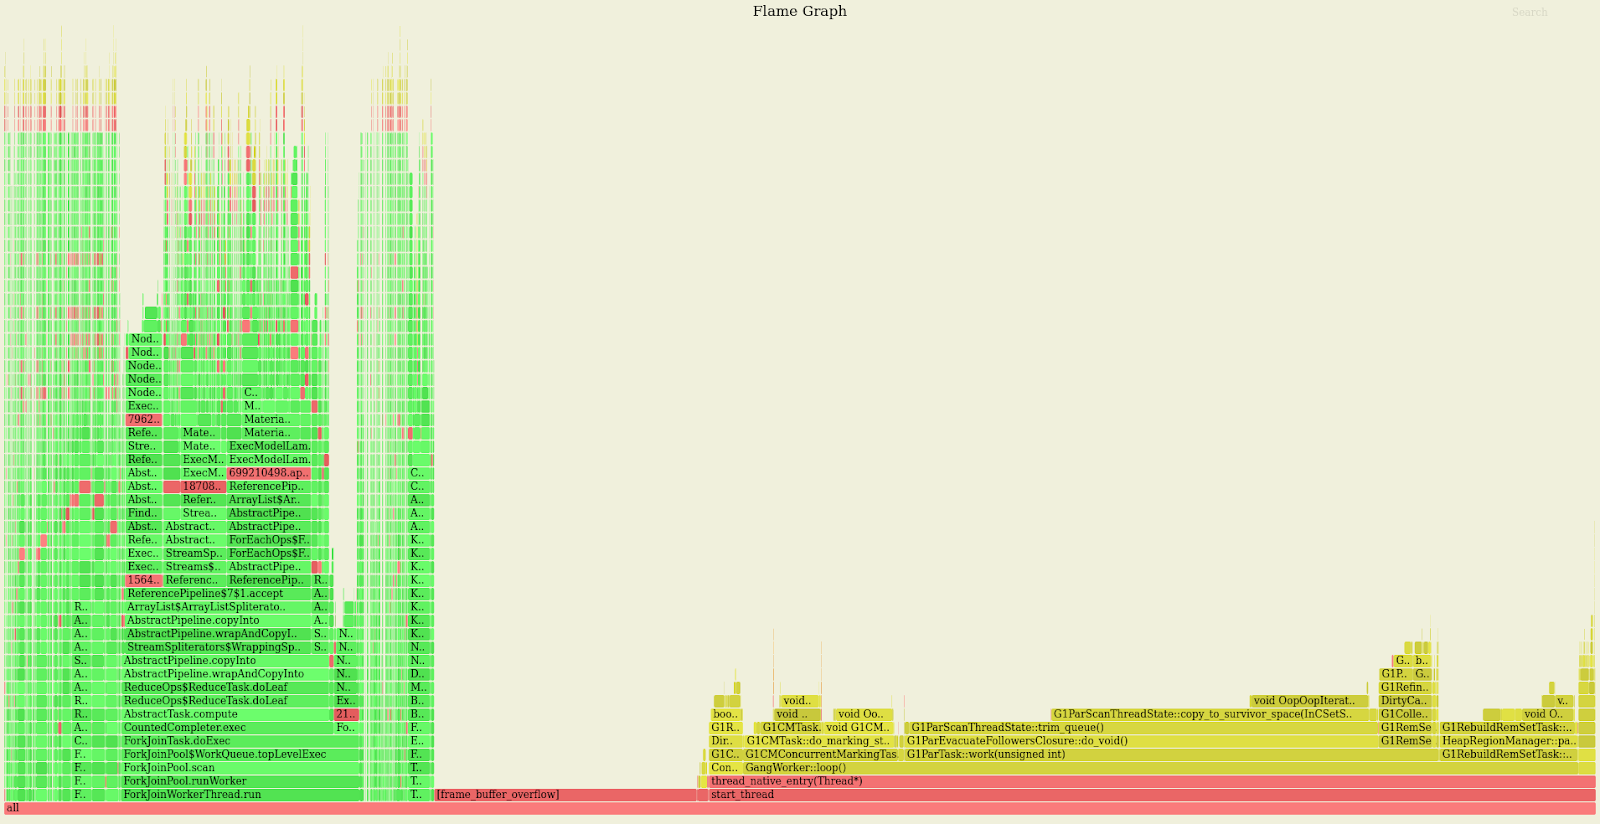
The colors in this flamegraph have this meaning:
- green are Java methods
- yellow are C++ methods
- red are user-mode native calls
- orange are kernel calls
In our case it was clear that we were consuming the biggest part of the time collecting garbage instead of doing any useful work.
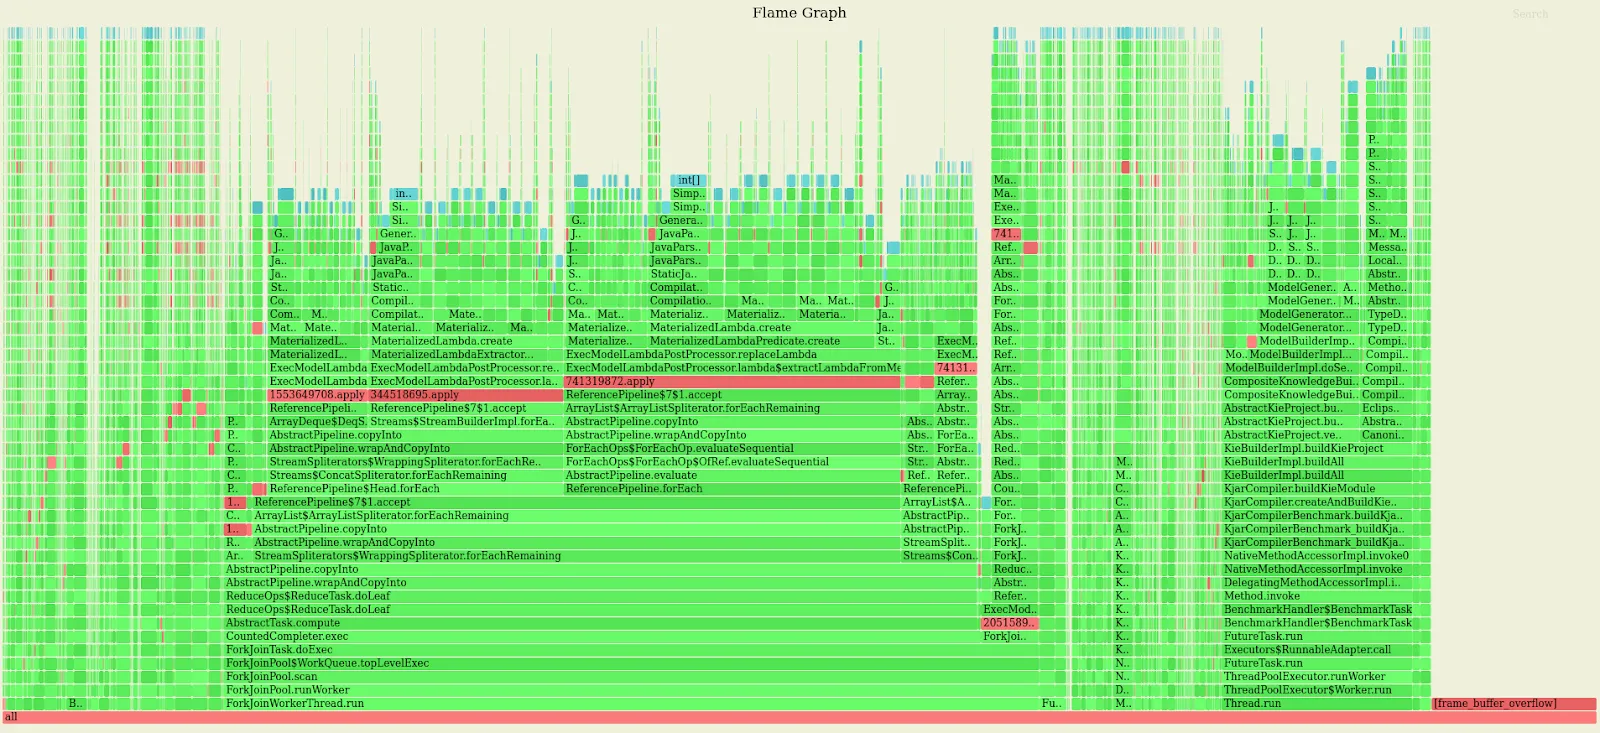
In other words our main problem was that we were allocating far too many objects but still we had no clue of what was the root cause of this. To discover this it was necessary to rerun the benchmark, but this time profiling the memory allocation using the argument event=alloc. Note that to profile the memory allocation with async-profiler you need to run it on a JVM compiled with HotSpot debug symbols. By doing so we obtained the following flamegraph.
Reading and interpreting this graph is not trivial because the objects’ allocation is of course scattered on almost every method execution. For each profiling session however, asnyc-profiler also generates a second flamegraph showing the stack in reversed order, that in situations like this can be of more immediate readability.
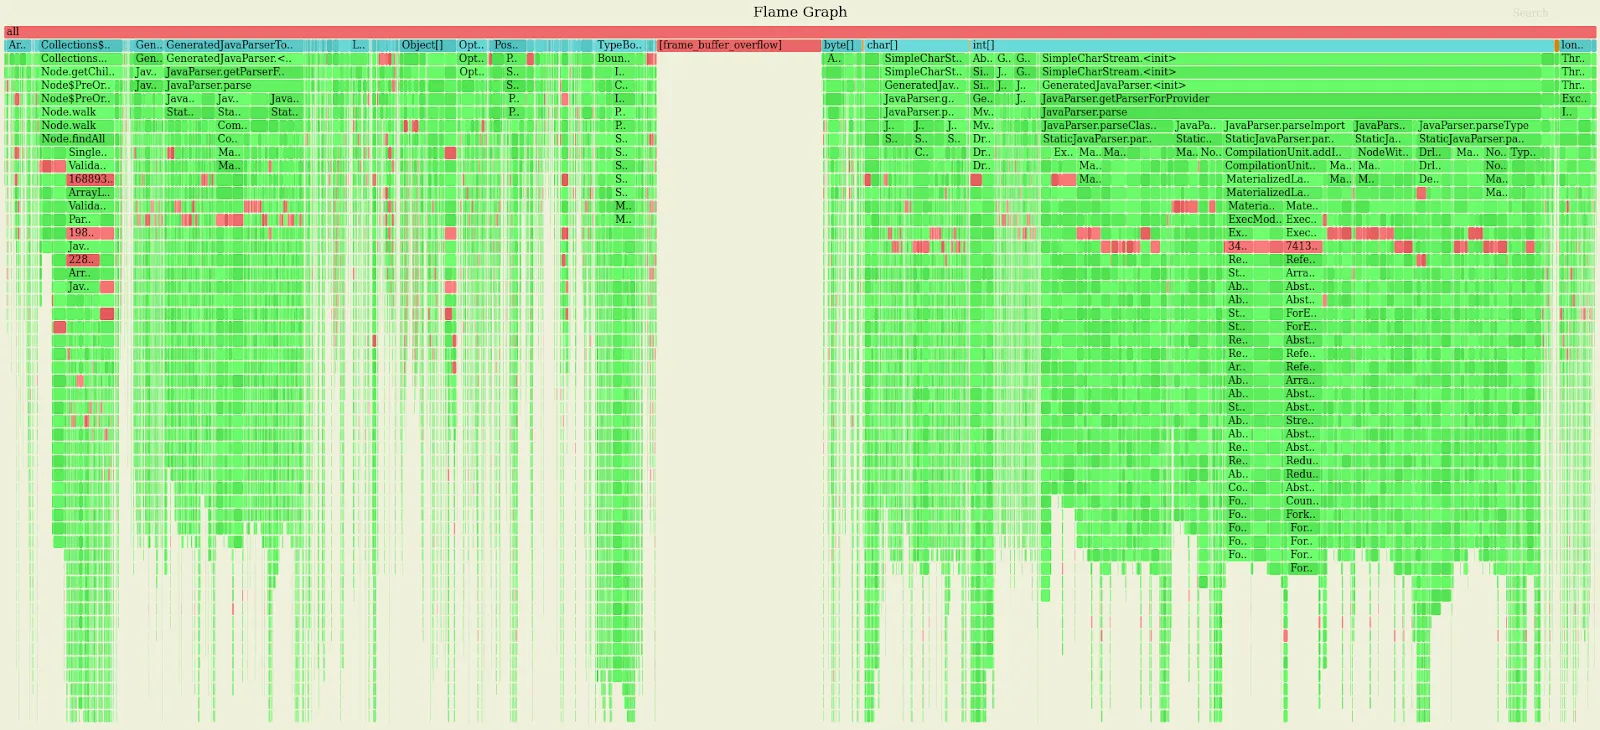
Here the main culprit of the excessive memory allocation is much more visible: JavaParser is creating a lot of Streams to repeatedly parse very small portions of Java code.
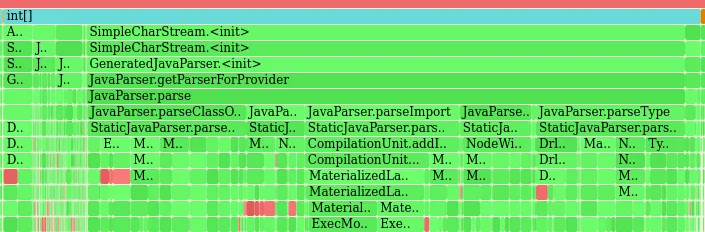
It tuned out that we are misusing JavaParser forcing it to perform thousands of microparsing when adding an import or an annotation to an AST or simply to convert a String representing a Class name into the corresponding JavaParser Type in order to use it with the rest of JavaParser API. For instance to add an import to a JavaParser CompilationUnit we did something like:
cu.addImport(“java.util.List”);
This caused JavaParser, something that in all honesty isn’t immediately evident from its documentation, to trigger a parsing of the String “java.util.List” in order to internally create that portion of AST representing it. This can be easily avoided because we already know in advance how that AST should be made. Replacing the former statement with one that programmatically creates the AST portion for the import to be added like the following:
cu.addImport(new ImportDeclaration(new Name(“java.util.List”), false, false));
made it possible to avoid all those unnecessary and memory consuming parsing operations. The combination of the parallelization of the executable model generation, of the savvier usage of JavaParser API and other micro optimizations found during our profiling session allowed us to bring the time required to generate the executable model for the project under benchmarking from the original 133 seconds
Benchmark                             Mode  Cnt    Score    Error  Units
KjarCompiler.buildKjarFromBigProject    ss    5  133.018 ± 15.665   s/op
to the current 32.
Benchmark                             Mode  Cnt    Score    Error  Units
KjarCompiler.buildKjarFromBigProject    ss    5   32.823 ±  7.883   s/op
We are willing to continue this profiling effort and keep improving the performances of Drools in this and other areas in the near future.
The post Profiling and optimizing executable model generation appeared first on KIE Community.