Process Mining Transformations — Part 7: Domain Specific Transformations

This is the 7th article in our series on typical process mining data preparation tasks. You can find an overview of all articles in the series here.
In earlier editions of this series, we have shown some common data transformations that happen more frequently.
However, most data transformation tasks are domain-specific. The data comes in a certain form and to truly answer your analysis question you need to re-shape the data a little bit. Fran Batchelor from the UW Health Nursing Informatics Department allowed me to share one of her data transformation examples from a recent analysis to illustrate this point.
In this example, one department at the hospital has a dedicated block of time in a surgery room that they can use for their surgeries. If no surgeries are planned by them, then the block opens up to other departments at the hospital as well.
If, on the other hand, they want to schedule a surgery and no room is available, then they have to wait for a room to open up. The perception among the staff of the department with the dedicated block of time was that this happened frequently. The general feeling was that they “can’t get their cases on the schedule” and that they “need more block time”.
Fran’s analysis was aimed at confronting this gut feeling with actual data. She wanted to look at how often it actually happened that surgeries had to wait and why.
The data came from three different data sources that she had already combined into an event log. She shared an anonymized sample of 15 cases for the purpose of illustration in this article. You can see the events from one single case in the screenshot below.
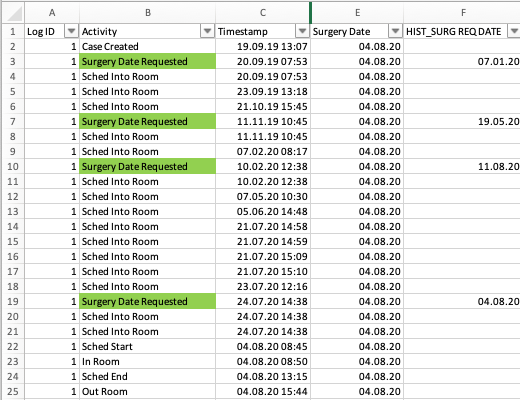
Figure 1: Data snippet of one case (Log ID 1)
As we can see in the data snippet above, a surgery date was requested four times (see ‘Surgery Date Requested’ activities). In between, several re-planning activities happened (see ‘Sched Into Room’ activities). Ultimately, the surgery took place on 4 August 2020. We can see that it took longer than planned: The ‘Sched End’ activity indicates that the surgery was scheduled until 13:15. But the ‘Out Room’ activity shows that the surgery actually ended at 15:44.
This data would be suitable to analyze how many surgeries take longer than scheduled. However, for the purpose of analyzing the availability of the blocked rooms in the operational flow of the department, this process view is too high-level. For example, the ‘Surgery Date Requested’ activity does not show whether a room was immediately available nor into which room it was scheduled (see screenshot below – click on the image to see a larger version).
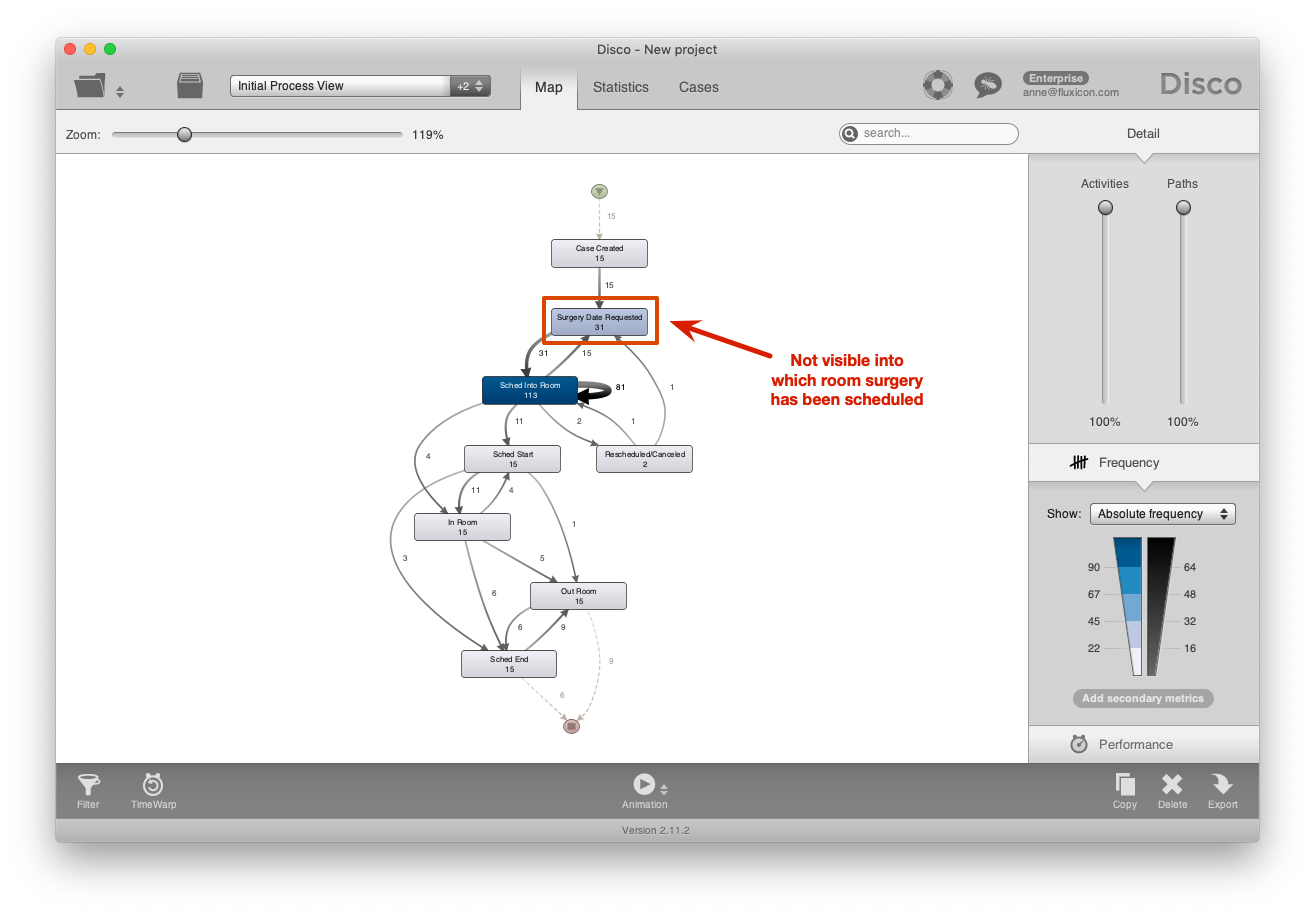
Figure 2: Initial process view with the main activities
The data set contains the availability information in an additional column called ‘Z Rm & Block Status’ (see screenshot below). When the value is ‘Block’ then there was an availability in the dedicated block for the department. This is the ideal situation. When the value is ‘Unblocked OR Room’ then there was no space in the block but another operating room was available. When the value is ‘Z Room’ then this means that no room was available at all. The case has been scheduled into a virtual holding room, which does not exist and is only a waiting position to be assigned a real room later.
However, Fran wants to analyze the availability at the moment that the surgery date is requested. The data is not in a form that is immediately usable to answer this question, because the ‘Z Rm & Block Status’ information is only attached to the ‘Sched Into Room’ events — not the ‘Surgery Date Requested’ events (see red highlighting). What she needs for her analysis is the ‘Z Rm & Block Status’ information of the first ‘Sched Into Room’ activity after the ‘Surgery Date Requested’ activity (highlighted in green below).
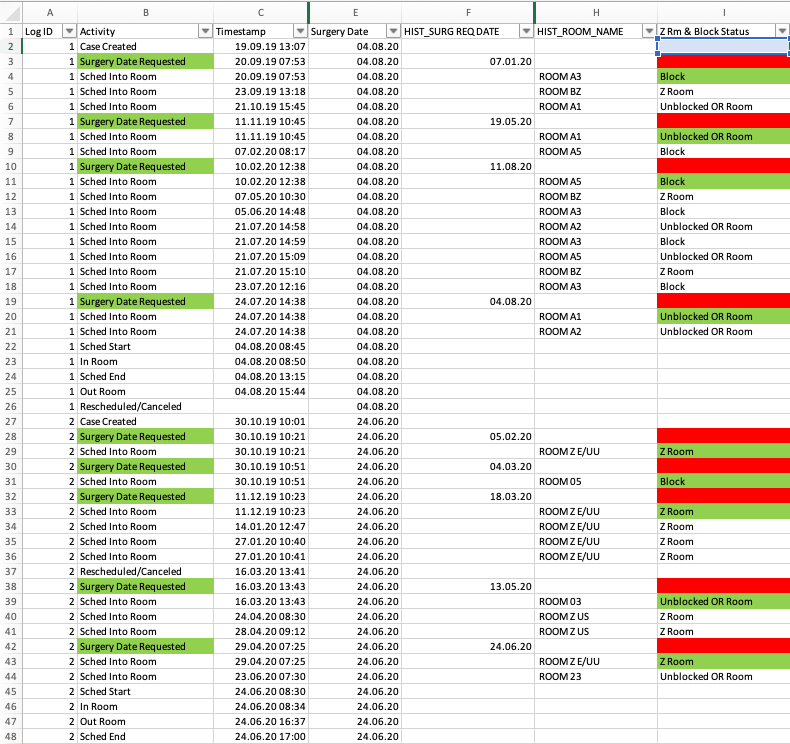
Figure 3: The ‘Z Rm & Block Status’ field shows whether a room was available or not (but not for the ‘Surgery Date Requested’ activity)
To make this information available, she adds two new columns to the data set. In the first additional column, the ‘Z Rm & Block Status’ information is combined with the location information (see the Excel formula and the resulting values in the yellow fields in the screenshot below).
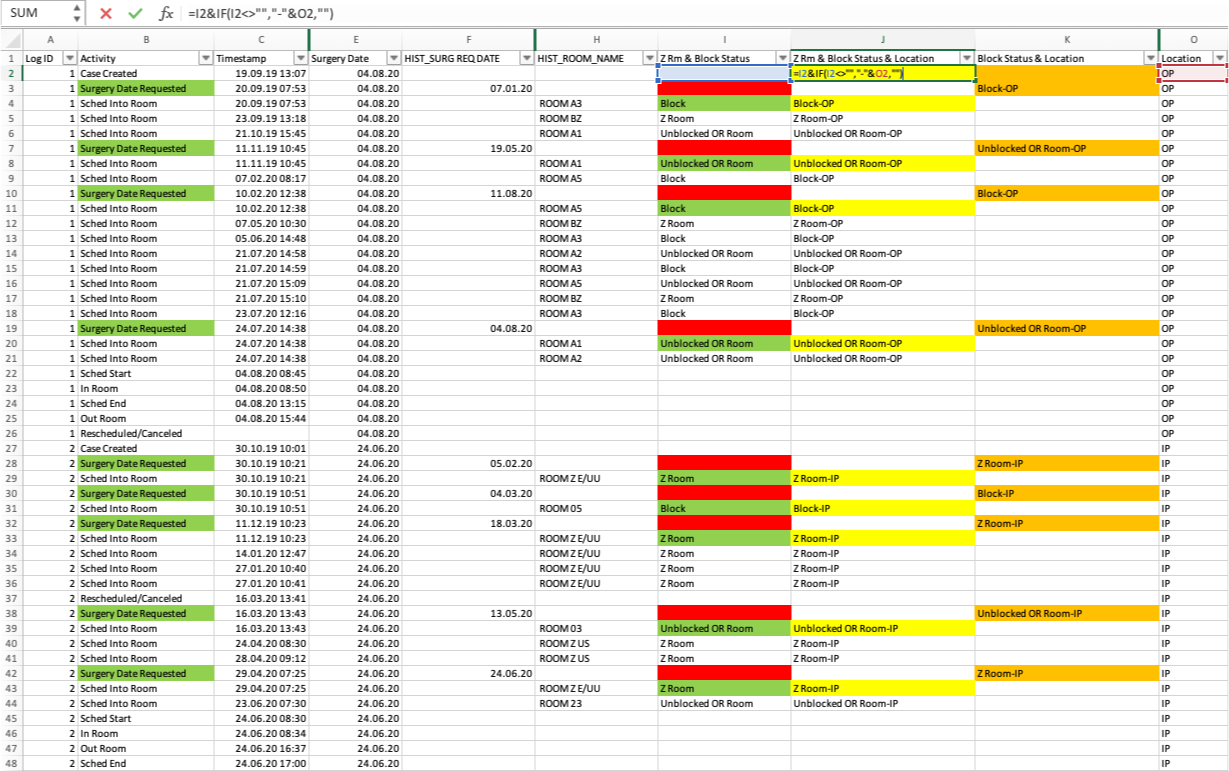
Figure 4: The first additional column combines the ‘Z Rm & Block Status’ information with further location information
The second additional column then takes this newly combined value from the previous column and makes it available for the ‘Surgery Date Requested’ events, where it is needed (see the Excel formula and the resulting values in the orange fields below).
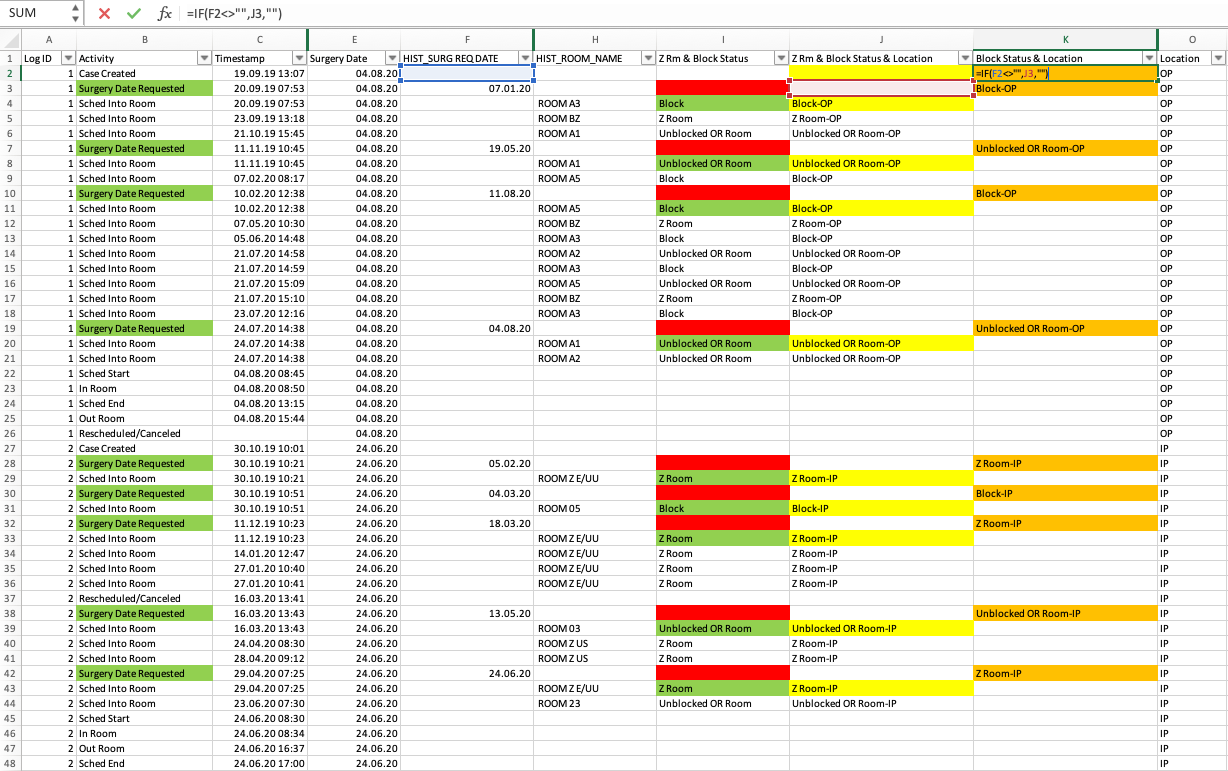
Figure 5: The second additional column attaches the newly combined field to each previous ‘Surgery Date Requested’ event
When you create new data fields via formulas in Excel as shown above, then keep in mind that you need to save the file as a CSV file before you import the extended data set into Disco again. Otherwise the values that have been created by the formulas are not visible.1
During the import step, Fran can now select the two new columns together with the original ‘Activity’ column as the activity name (see screenshot below).
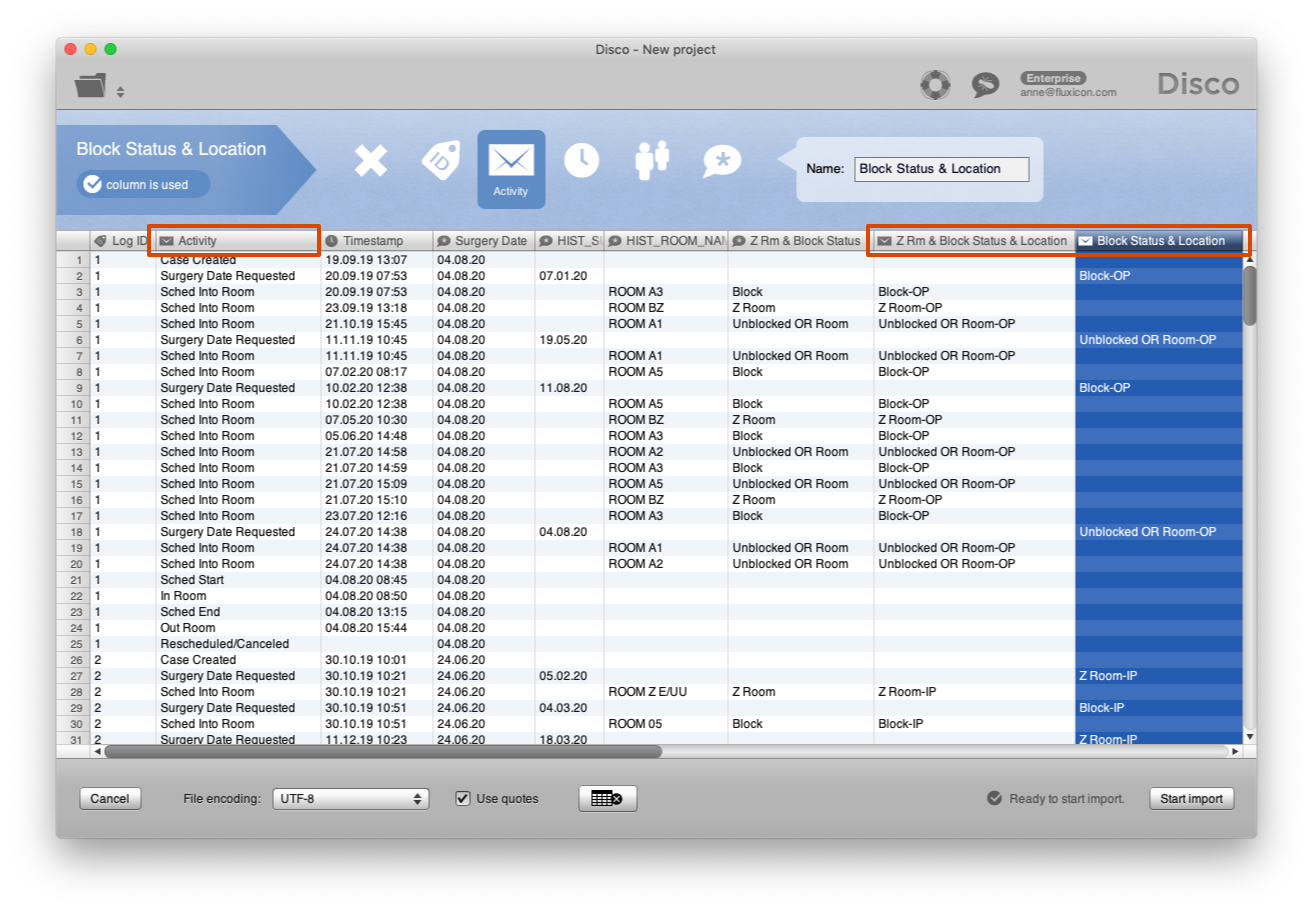
Figure 6: The high-level activity name can be combined with the detailed room status information
As a result, both the ‘Sched Into Room’ activities as well as the ‘Surgery Date Requested’ activities are now “unfolded” depending on their availability status. This provides a much more detailed view on the scheduling flow in the process (see screenshot below).
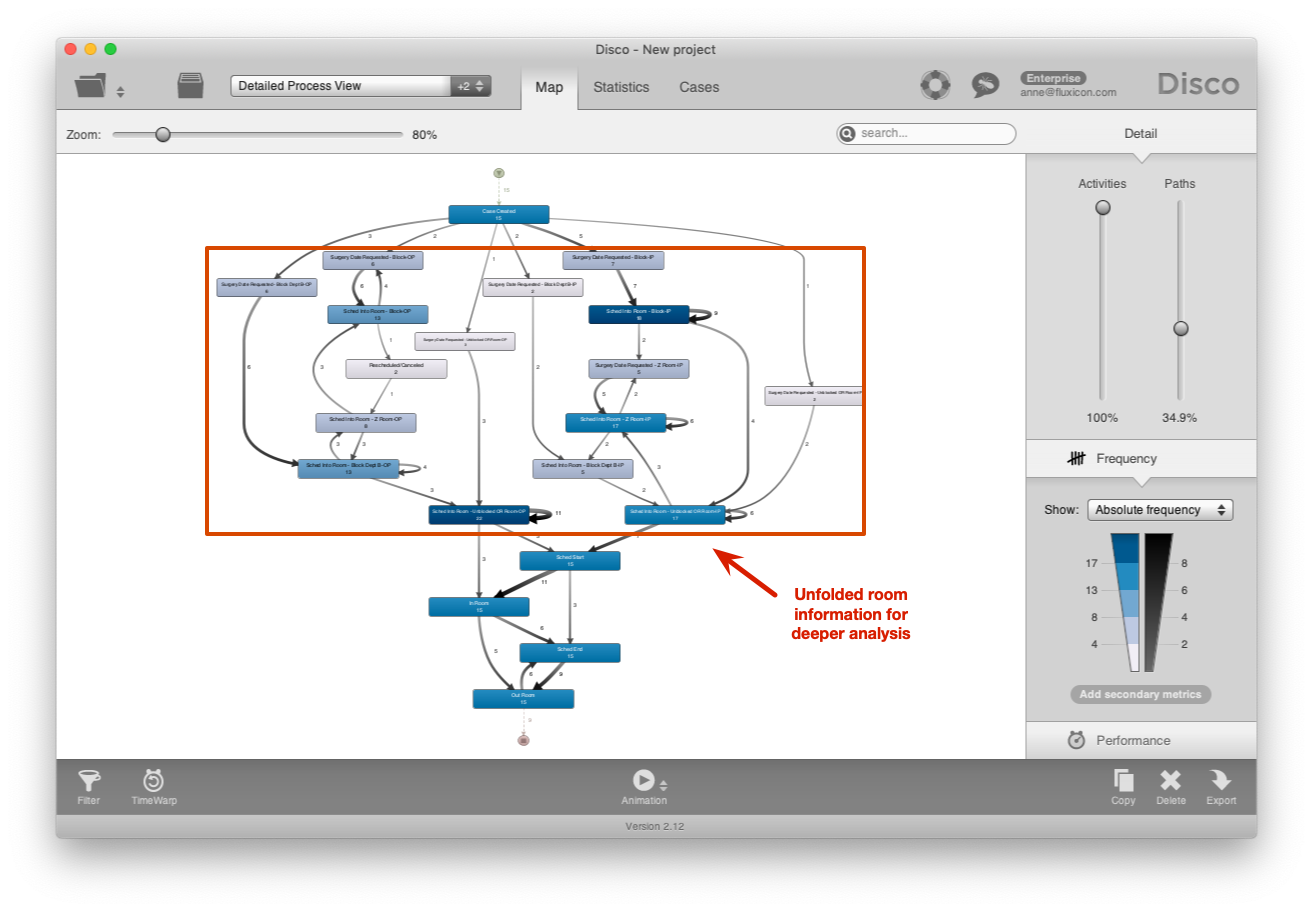
Figure 7: The scheduling and re-planning activities now show whether a room was available or not
As one of the analyses, Fran can now focus on the ‘Surgery Date Requested’ activities to see how often rooms were available at the moment of the initial surgery request. An Attribute filter can be used to filter only ‘Surgery Date Requested’ activities for an even more focused view.
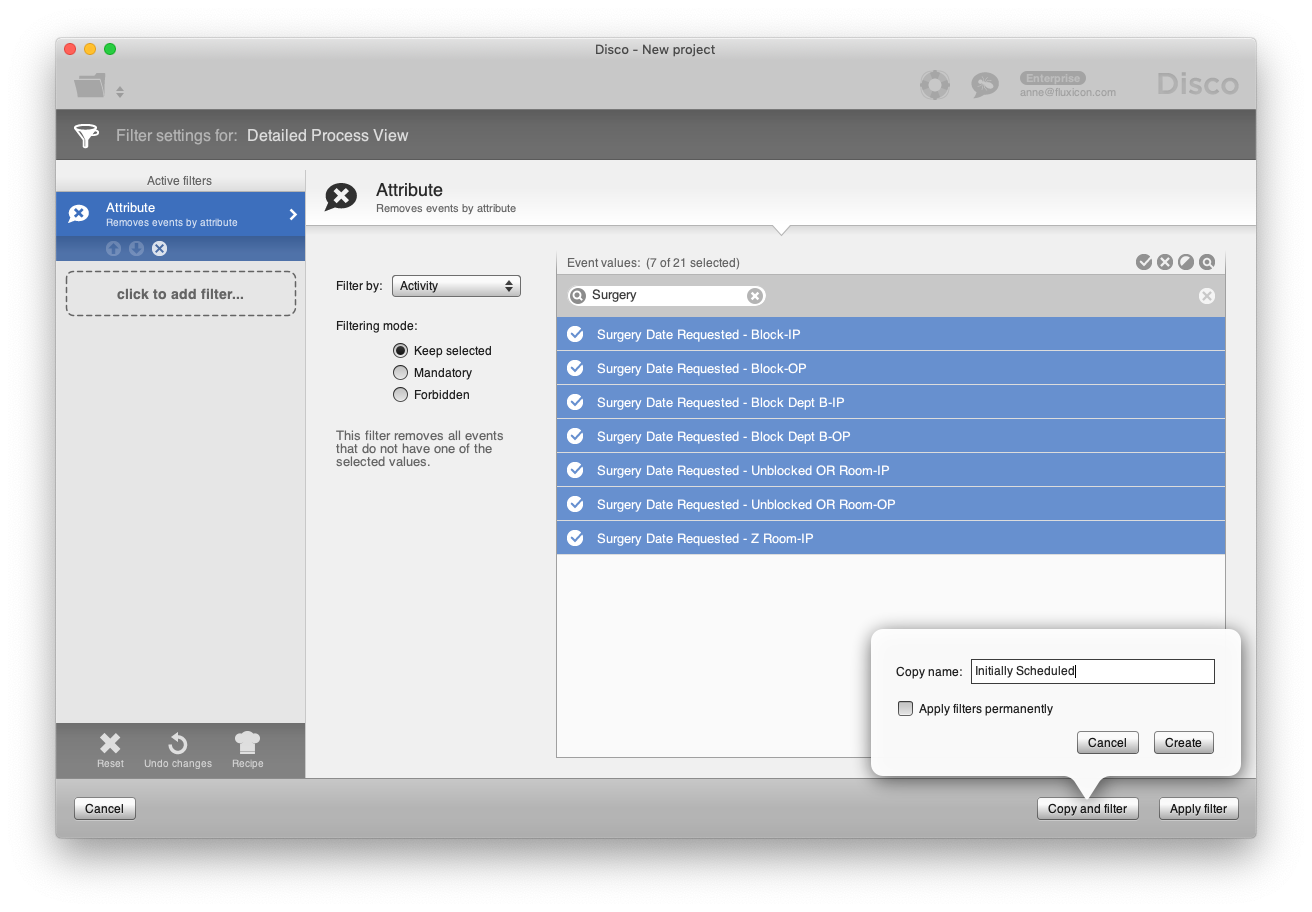
Figure 8: Focusing on ‘Surgery Date Requested’ activities
This view shows that new surgery dates were requested frequently even if the first request could be scheduled in the block time of the department right away (see red mark-up in screenshot below). These re-scheduling requests were often initiated by the staff or patients themselves and not due to the non-availability of the surgery rooms.
The resulting picture that emerged from the analysis showed that the reality was more complicated than the staff of the department with the dedicated block time initially thought. Based on Fran’s analysis, they could align their perception with the reality of the process. It became clear that being able to secure more block time would not necessarily solve the problem of the frequent re-scheduling and re-planning of the surgeries.
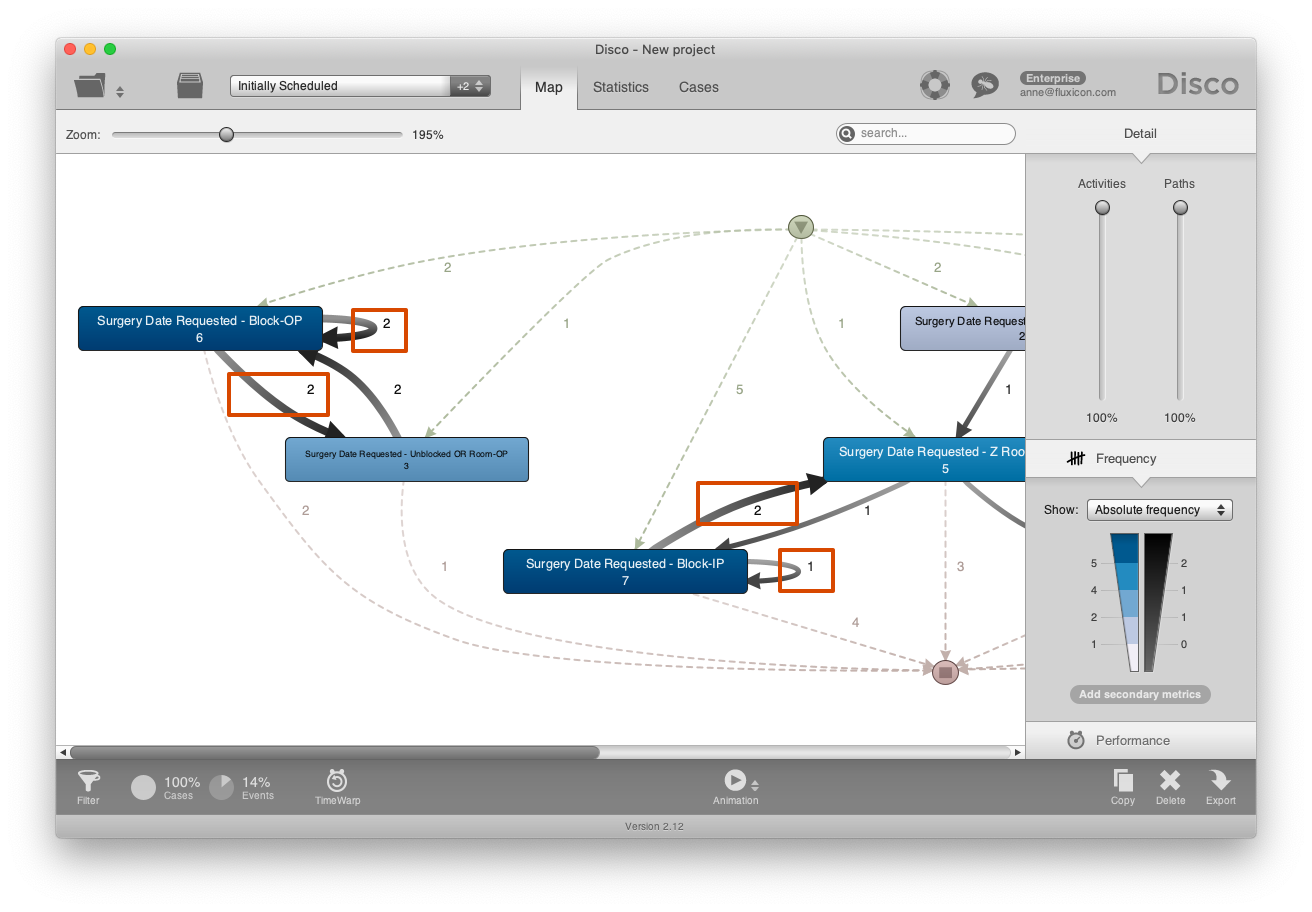
Figure 9: Surgeries are re-scheduled frequently even if the initial request could be accommodated by the block of the department
There are many different ways in which the data could have been transformed to get to the same result. The scenario above is just an example.
What is important to realize is that the data is not fixed. You as the process mining analyst need to think about how exactly you need your data set to be to answer the questions for your analysis (and to communicate with the people who work in this process).
Furthermore, there is almost never just one view that can be used to answer all your questions. Instead, different views are needed to answer different questions, and sometimes the data needs to be transformed in different ways as well.2
-
Copying the columns with the Paste as Values option is another alternative. ↩︎
-
While multiple domain-specific transformations may be needed, general concepts still apply. For example, it is generally a good idea to put additional attributes into separate columns, so that you can leverage them for filtering or for unfolding individual activities in the most flexible way. ↩︎
Leave a Comment
You must be logged in to post a comment.