Power BI: What is it and what is it used for?
Blog: AuraQuantic Blog
Business Intelligence Platforms (BIP), such as Power BI, are gaining importance in the business world. This type of software offers a more efficient means to measure and understand if the implemented actions and strategies are having the expected results or not.
Power BI is a type of BIP designed to collect, organize and analyze business information, with the aim of facilitating strategic decision-making and increasing the profitability levels of your business. An important step for all companies in the digital transformation process that do not want to compromise their survival in the market.
Next, we explain what Power BI is, what it is for and the benefits of opting for a much more personalized tool such as Power BI Embedded, which will allow you to have personalized reports, design dashboards, obtain information in real time, perform predictive analytics and receive smart alerts, among many other benefits.
What is Power BI?
Companies have an increasing volume of data for strategic decision making. However, this fact does not guarantee that the company will improve its business results. Therefore, it is essential to have a tool that facilitates data analysis in a simple, fast and intuitive way, such as Power BI.
Power BI is a Business Intelligence tool created by the technology multinational Microsoft, to put an end to the business gap that separates decision-making with data. The objective of this tool is to improve the understanding of the organization’s data and contribute to generating information and knowledge to reduce the levels of uncertainty and improve the decision-making processes.
The Power BI tool consists of a wide range of software services, applications and connectors that work together, resulting in congruent, highly visual and, above all, interactive information. In other words, Power BI translates the bulk of an organization’s data into charts, dashboards, and reports, thus ensuring a maximum level of understanding from management teams and other employees in the organization.
In short, Power BI is an advanced reporting tool, designed to generate knowledge within organizations, to later apply it in strategic decisions.
What is Power BI used for?
As we have seen, data is one of the most important assets for companies, due to its transversal nature that involves all the departments of an organization. The greater the amount of information known and analyzed by the company, the more its margins for error are reduced and its chances of success increase.
For this reason, and given the need to adapt to the multiple needs and demands of the market, Power BI can be enjoyed in three different ways:
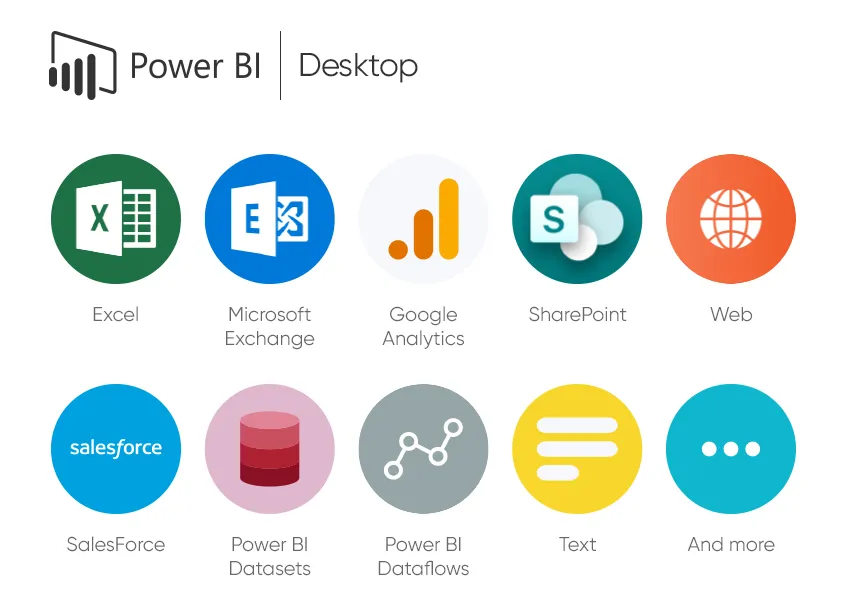
Power BI Desktop (PB Desktop)
It is the PB desktop application that allows you to import data from various sources (Excel, SQL database, text or CSV, web, etc.), use it to create customizable visuals such as charts, maps, infographics and many other available elements in the Power BI Marketplace, and finally, save a copy and share it with the desired employees.
The most common uses for PB Desktop are to:
- Establish a connection with different data sources.
- Transform and clean data, to create your own data model.
- Create visual objects, such as charts and maps.
- Create multi-page reports.
- Share reports with other users, through the PB service.

Power BI service (PB Service)
Online service, commonly known as Software as a Service (SaaS). It refers to a software delivery model, in this case Power BI, based on the cloud and under subscription.
This option allows users to access and use Power BI, through the app.powerbi.com with a simple internet connection, since the data processing is based in the cloud.
In order to use this service, it is necessary to meet two requirements:
- Be registered in the PB service.
- Have previously uploaded and published data from the different sources established by the PB service, through the PB Desktop service.
The elements that you will be able to work with through the PB service are:
- Navigation panel.
- Microsoft 365 application launcher.
- PB Home button.
- Icon buttons.
- Search box.
- Favorite panels (the most used).
- Work areas and reports.
- Reports created by the Power BI Community, based on criteria established by the tool’s team.
Power BI App (PB App)
The PB mobile application has a specific version for Android, Windows and iOS devices.
Next, we will take a brief look at each of them:
Android
All devices that have Android 5.0 or later operating systems can download the PB application for Android from Google Play.
This application allows you to use the Power BI Report Server and also SQL Server Reporting Services.
On the one hand, the Power BI Report Server is a local report server that has a web portal, through which users can view and interact with information.
On the other hand, through Reporting Services users can consume reports through a web browser, on mobile devices or via email.
The PB app for Android allows you to create reports in PB Desktop and publish them to the PB service and, also, publish them in Power BI Report Server.
Once this process has been carried out, the user can interact with local or cloud dashboards and reports, through the app for Android devices.
iOS
iPhone, iPad and Apple Watch are the three devices that incorporate iOS and from which you can access the Power BI application. The app, as in the case of Android, allows you to use both Power BI Report Server and SQL Server Reporting Services. In order to use them, you must have created reports in PB Desktop and published them in the PB service, or in Power BI Report Server.
Once this process is done, the user can interact with the reports and dashboards that are available to them in the cloud or locally.
Windows 10
If you have a device with Windows 10 OS and with at least 3 GB of RAM and 8 GB of internal storage, you can download the PB app from the Microsoft Store. In addition, the device must have a minimum resolution of 460 x 500 pixels.
After installing the application, the user will have full access to all the information shared and generated in the PB service.
Power BI Embedded: One step further
If you are already part of the AuraQuantic family and have contracted our services, you must already know about Deep BI. A product from AuraQuantic for reporting, with a Drag & Drop interface, which allows you to create basic reports, very easily and quickly.
However, if you want to go further and incorporate the latest advanced reporting technology into your business, the product you need is Power BI Embedded. A perfect tool for the preparation of advanced reports, where security, high levels of customization and its lower price, by saving on Microsoft licenses, make it so popular.
Now, at this point, you may be wondering what differences exist between PB and PB Embedded. Read on, because we have compiled a complete list of benefits that make PB Embedded the essential tool for your business.
- It is a tool built from Power BI, but with the AuraQuantic guarantee and quality, considered the ‘Best Low-Code Platform’ on the market.
- It has the same functionalities as Power BI.
- Incorporates security improvements and integration with AuraQuantic, compared to a traditionally embedded report. This is due to the fact that we send a greater volume of information to the tool and because it is directly connected to the AuraQuantic API.net.
- With PB Embedded you don’t need to have Microsoft accounts.
- Cost reduction: The cost associated with a Power BI account is avoided, which has a price of between €8.5 and €16 per user per month.
- Unlimited users: With PB Embedded you can consume all the Power BI reports you want, just by having an AuraQuantic license.
- The most economical advanced reporting tool on the market, even for professional use, such as that carried out by a company’s Analytics Department. This is because any reporting tool is going to be more expensive, including Open Source (if the costs derived from hosting and maintenance are taken into account) or the Microsoft equivalent (PB Premium), starting at €4,220 per month.
- Intended for companies looking for a high degree of report customization (and want to go beyond Deep BI).
- Allows you to create reports for external personnel.
- Shows different data depending on the user who accesses, through filters, roles or groups built in AuraQuantic.
- Allows you to update and grow existing accounts.
- Personalized advice, at all times, by the best team of AuraQuantic experts.
- Free training on how to use the tool.
- Budget adapted to the needs of each client.

The post Power BI: What is it and what is it used for? appeared first on AuraQuantic.