One-Click Forecasting with TIBCO Spotfire
Blog: The Tibco Blog
Forecasting is a process to make future predictions based on past and present data. There are qualitative forecasting methods like the Delphi method which relies on a panel of experts. Quantitative forecasting methods forecast the future as a function of past data. Today, virtually every decision we make is influenced by some kind of forecast, starting from what to wear as a function of the weather forecast. Sound predictions of demands and trends are no longer for geeks, but a necessity for everyone. If organizations have to cope with seasonality, maneuvers of the competition, rapid technology changes, and large swings of the economy—forecasting can be a handy tool. It may still be driving forward while viewing the road through rear view window and that makes risk and uncertainty part of the process.
Holt-Winters forecast
This is one of the popular methods when data exhibits trend and seasonality. It is one of the exponential smoothing methods. The two main HW models are additive model for time series exhibiting additive structure and multiplicative model for time series exhibiting multiplicative structure
One-click forecast in Spotfire
The Holt-Winters Forecast uses TIBCO Enterprise Runtime for R (TERR) to compute the Holt-Winters filtering of a time series or anything that can be coerced to a time series. This is an important requirement which translates to visualizations having X-axis as time series data.
This is an exponentially weighted moving average filter of the level, trend, and seasonal components of a time series. The smoothing parameters are chosen to minimize the sum of the squared one-step-ahead prediction errors.
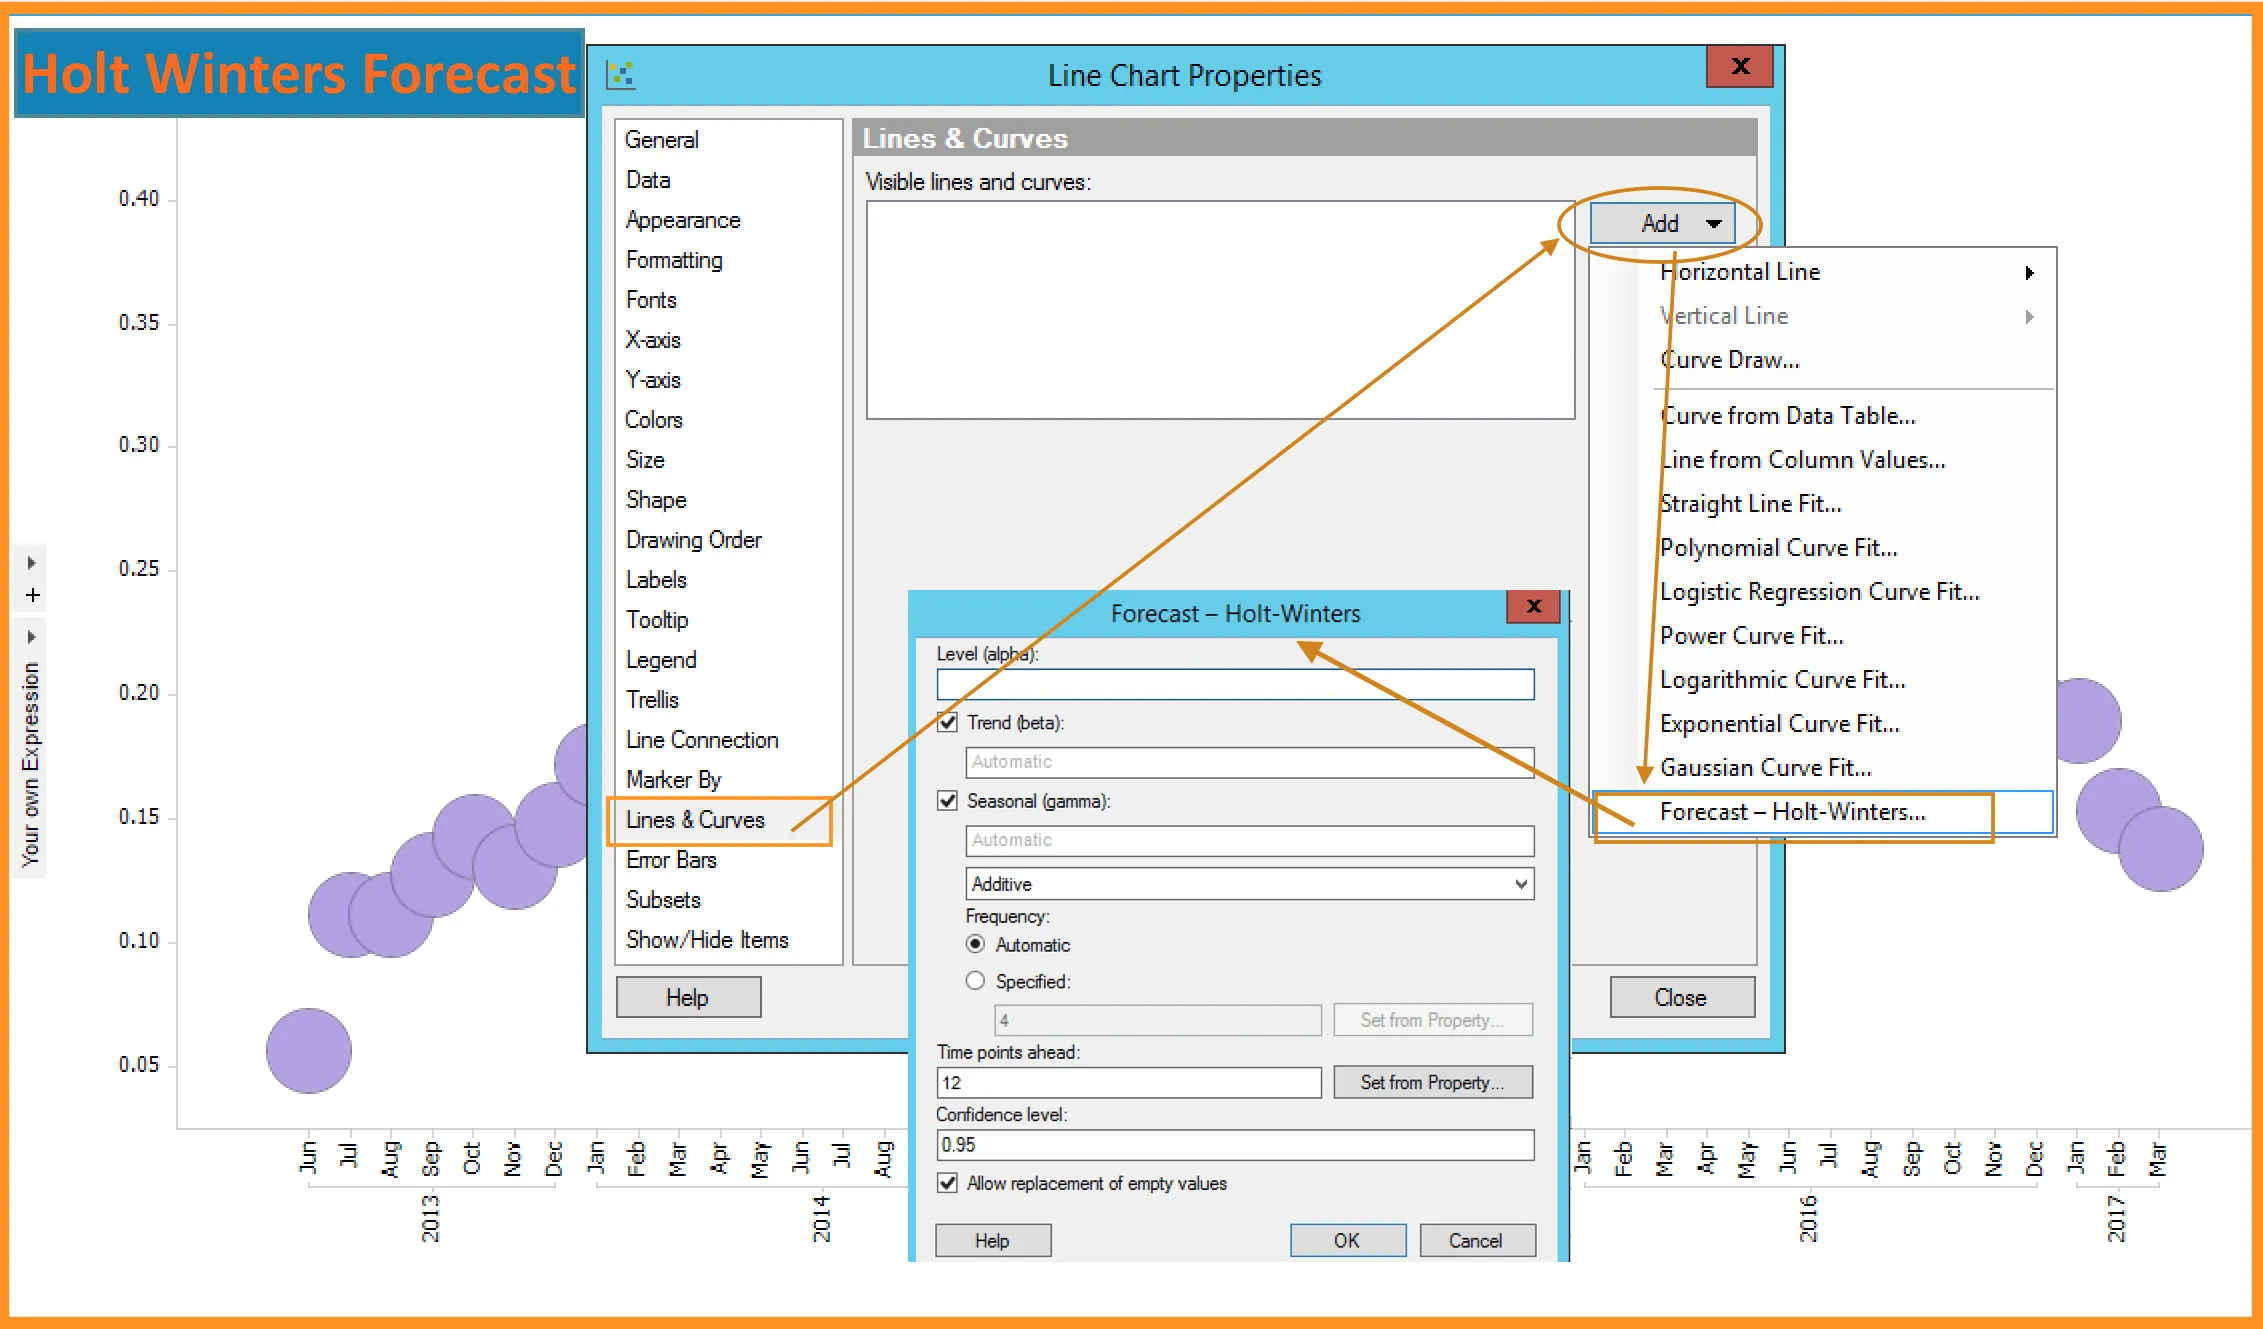
Adding Holt-Winters forecast curve in Spotfire
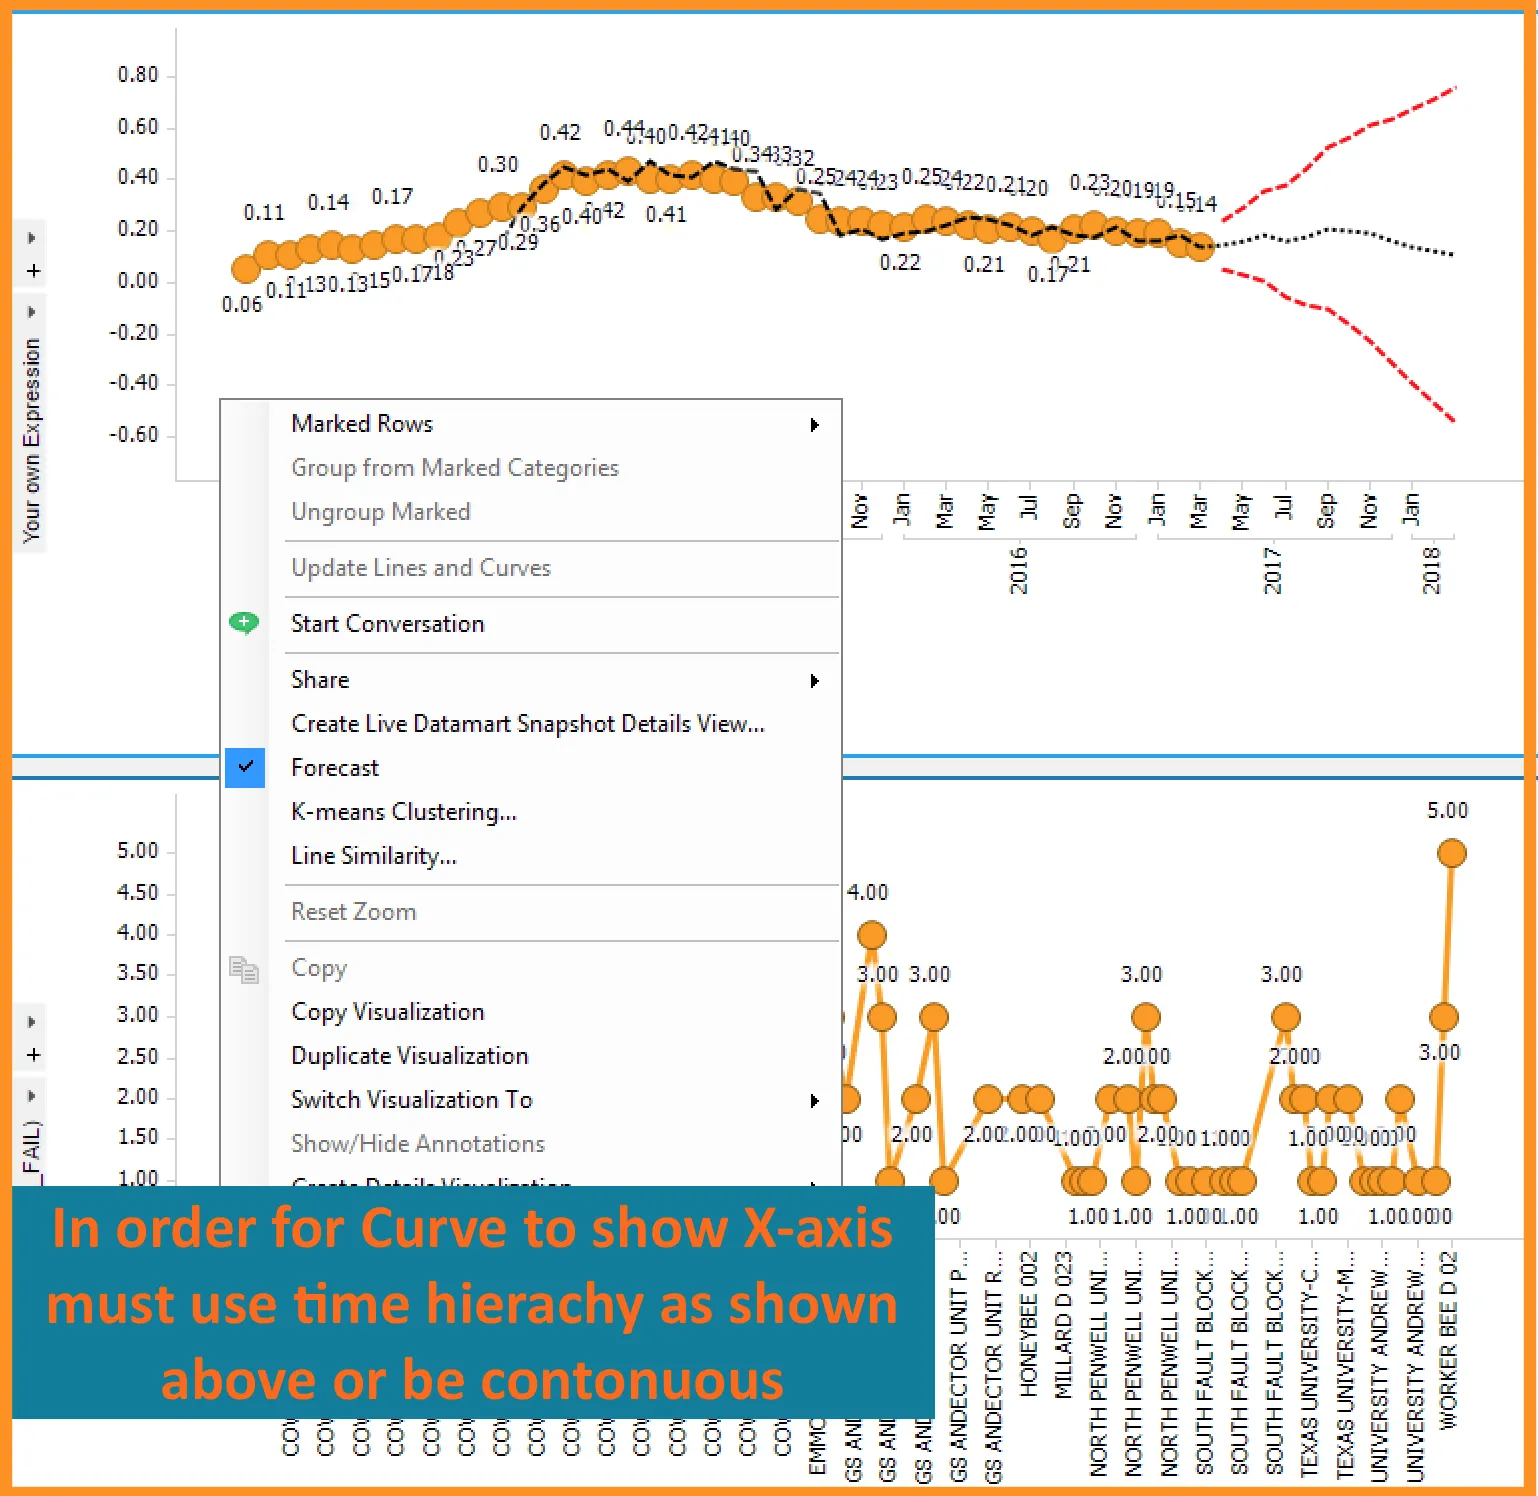
It is simple to add a HW forecast curve in TIBCO Spotfire. Either right-click and select Forecast or, under visualization properties, select Lines & Curves and then add Forecast-Holt Winters. The output of a Holt-Winters Forecast is three different curves:
- A fitted curve showing the general variation of the measure of interest
- A forecast curve predicting the future trend
- A confidence interval showing how the insecurity increases the further away from the known values the prediction reaches
The parameters are automatically calculated, but can be edited as well. It is also possible to have a curve for each color, line or trellis panel.
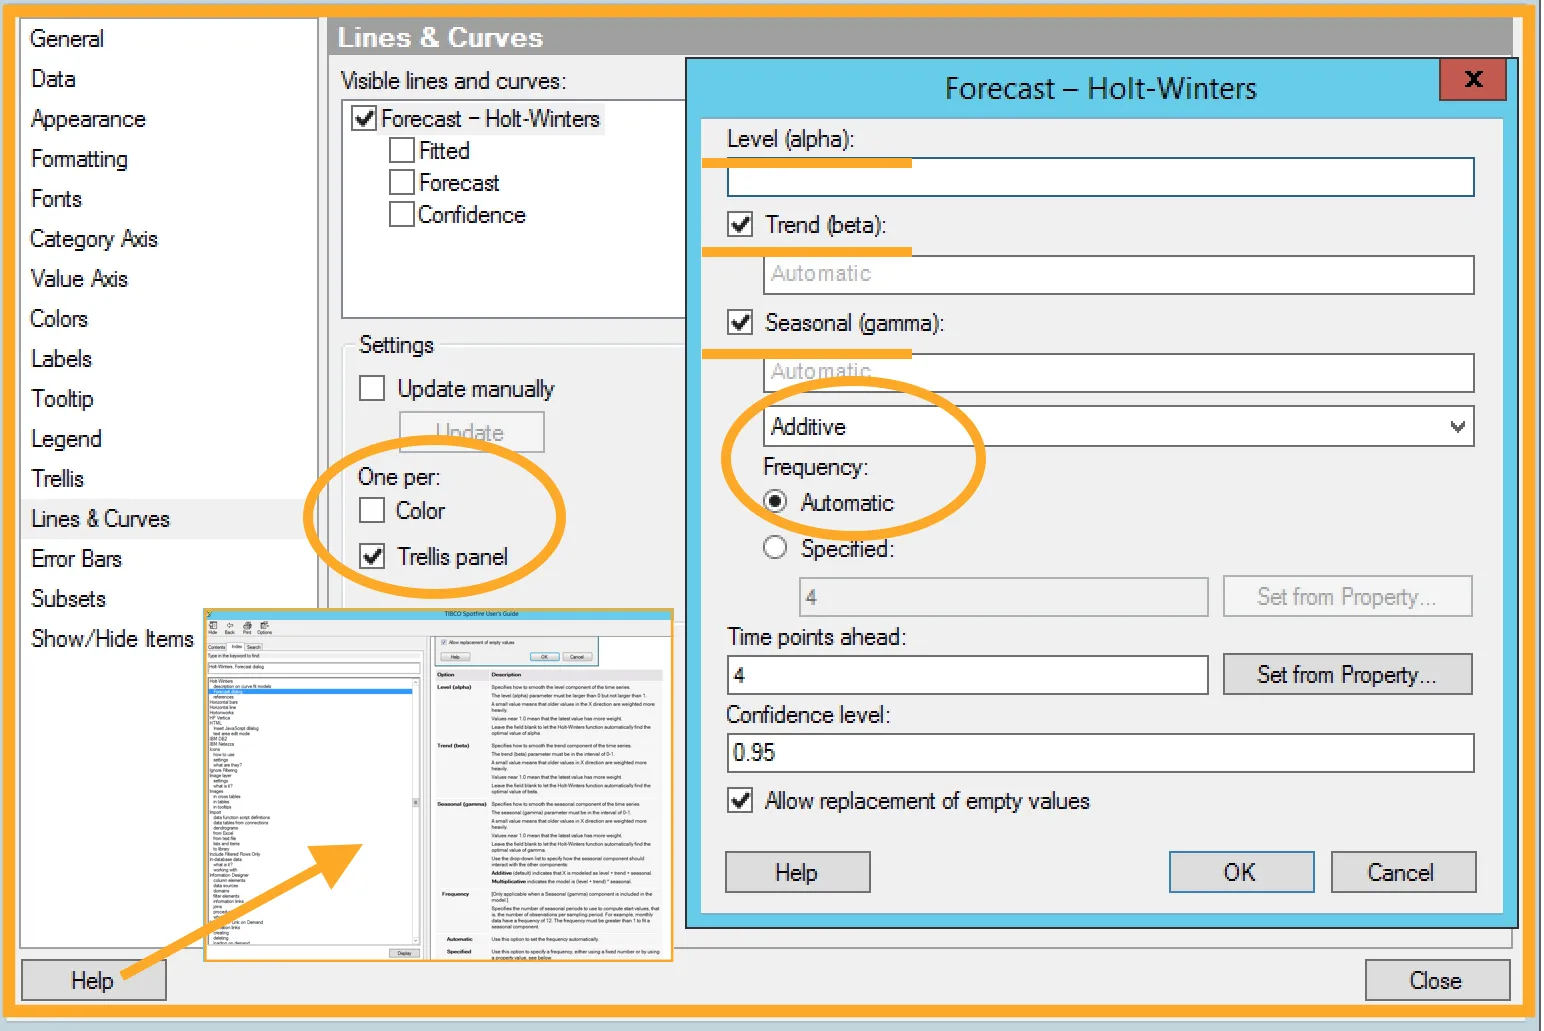
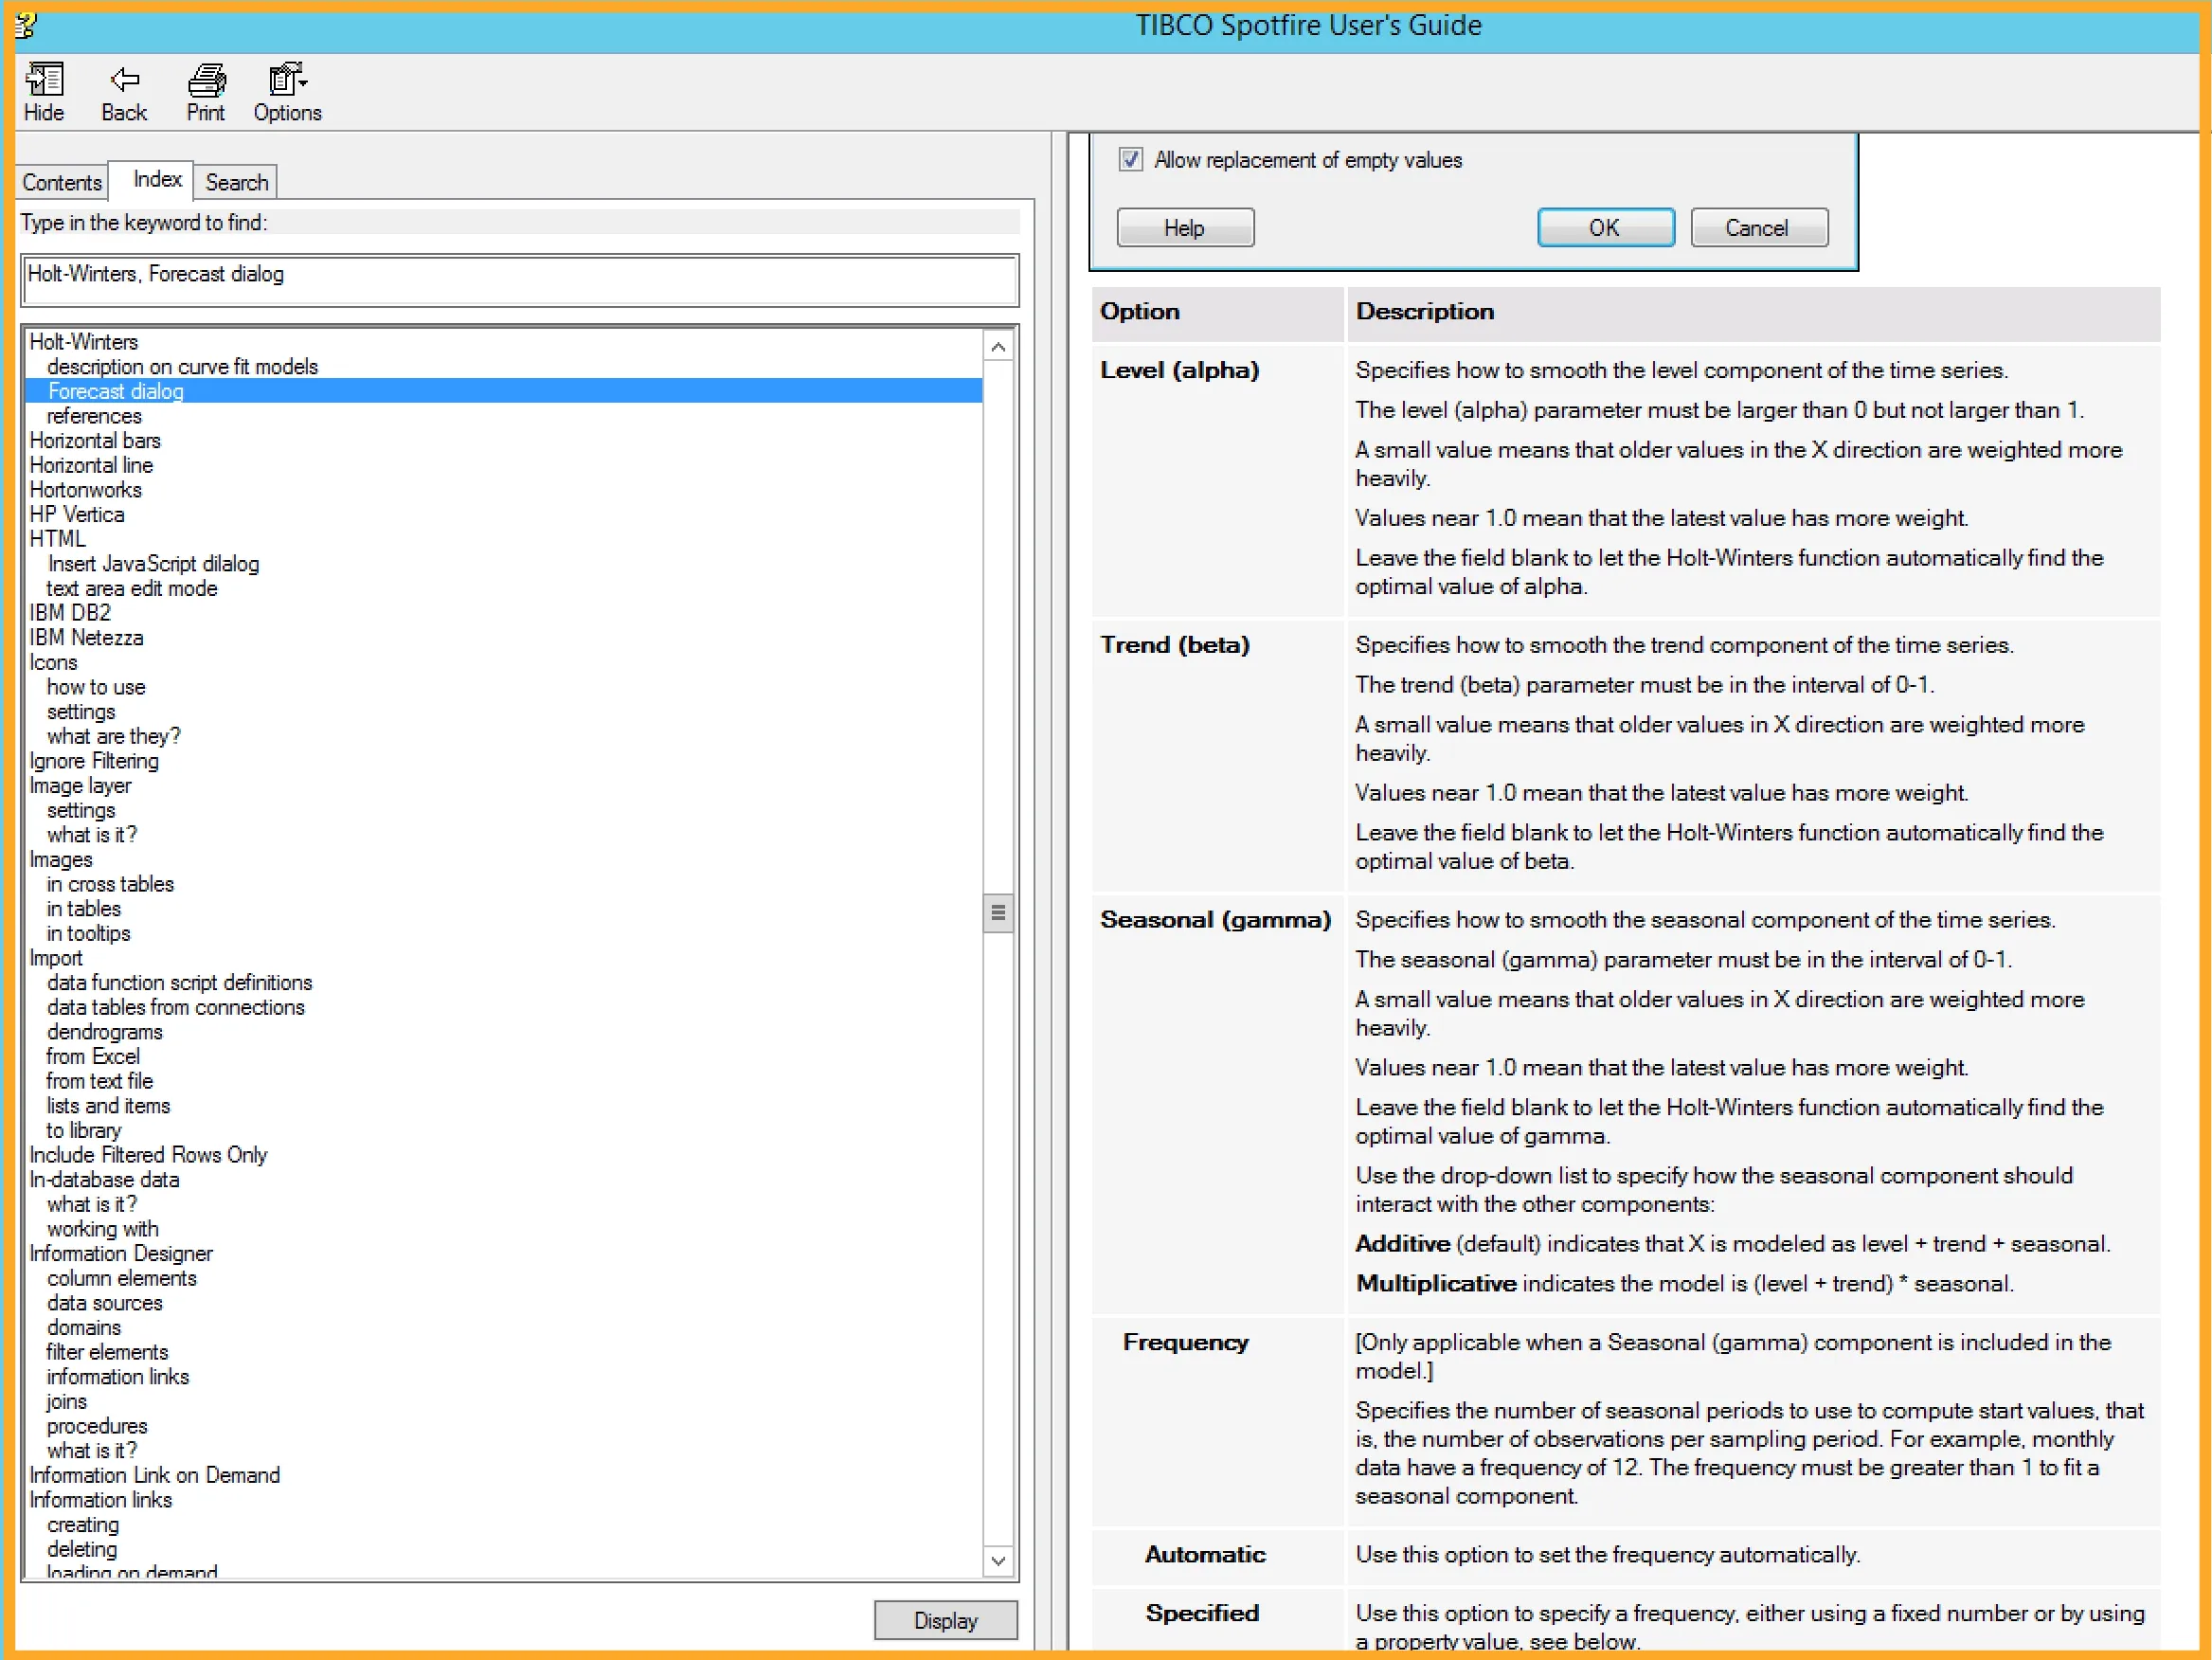
The Spotfire user guide provides detailed descriptions about each parameter.
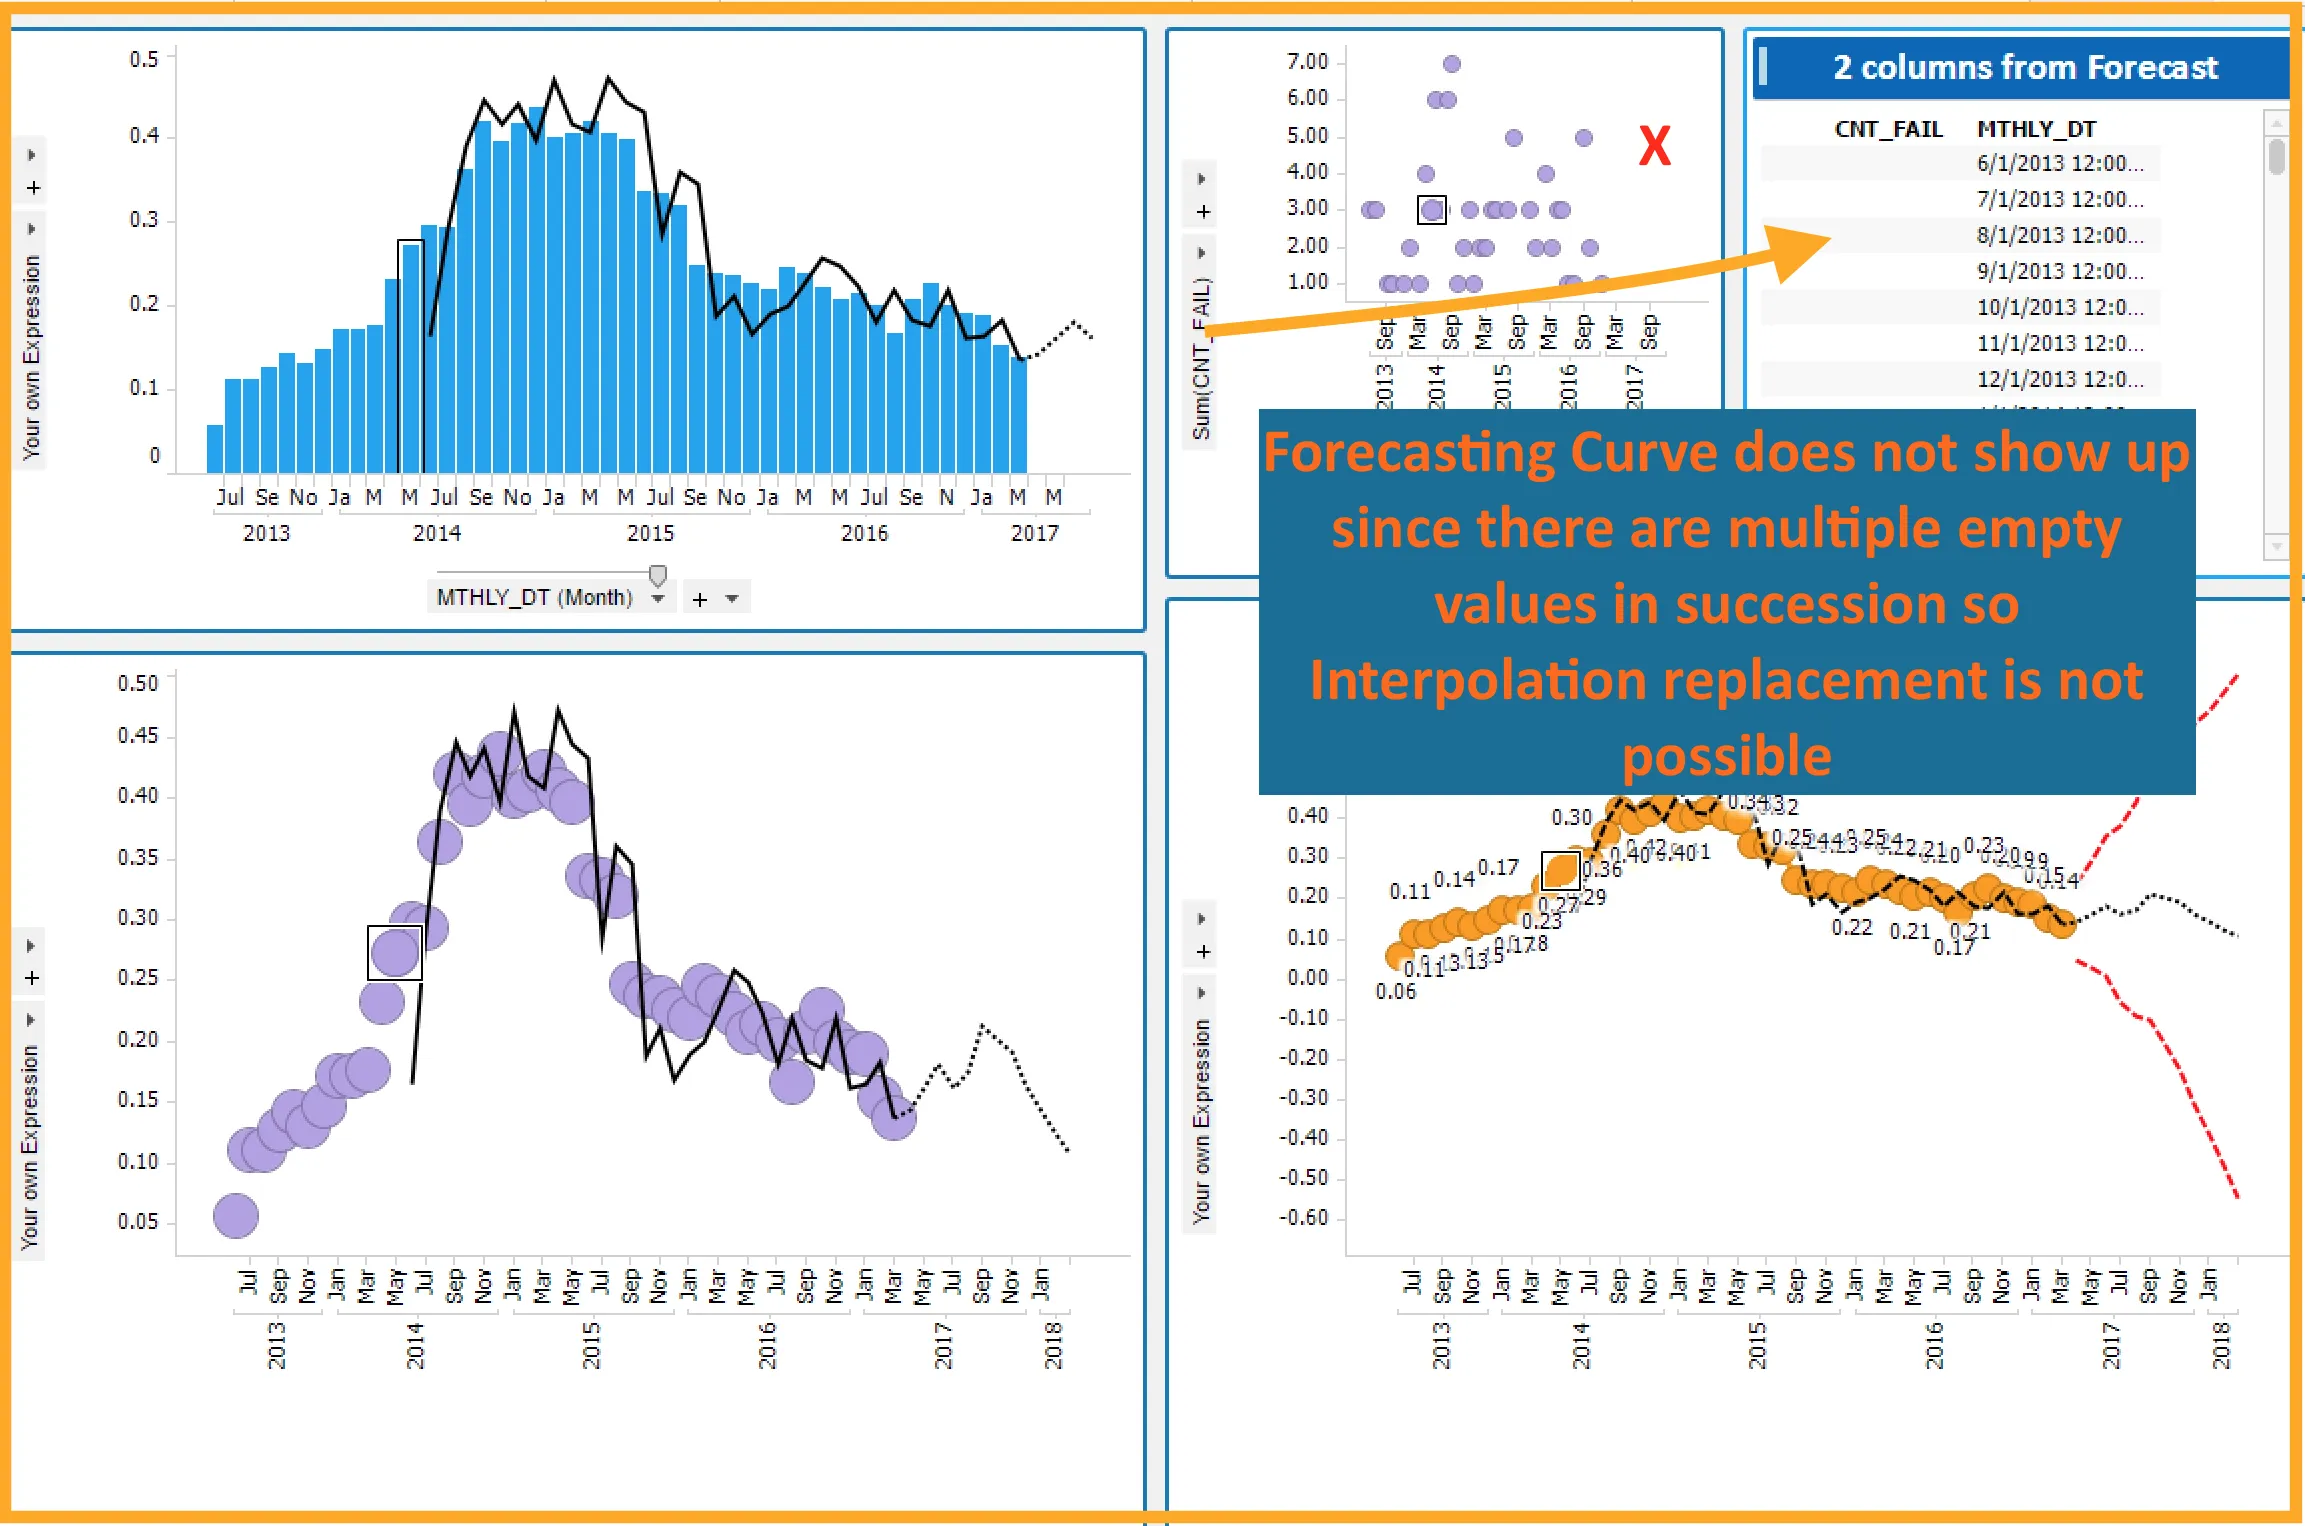
At times, the curve may not show up. When this happens, the user will be informed with a detailed error message specifying the reason like in the example below (multiple empty values in succession is the reason you do not see curve). Forecast curves aren’t limited to line charts; they can be added to other visualizations like scatter plots, too.
Learned something new today? Give TIBCO Spotfire a try to try out your new knowledge. Start a 30-day free trial today.