O Tannenbaum, O Tannenbaum, How Lovely is Thy Data
Blog: The Tibco Blog
Reading Time: 2 mins 30 sec.
From the famously sparse but quaint “Charlie Brown” Christmas tree, to the whimsical, Grinch-inspired “grump” tree, evergreen trees have been a symbol of the holiday season, dating back to medieval Europe. Today, it’s a booming industry for both real, and artificial trees as well.
Christmas trees, actually classified as a crop by the USDA, have become much more than the centerpiece of the holiday (for those who celebrate); it’s an integral part of the holiday landscape that reaches beyond the living room. With so many tree varieties available, different colors, new lighting technologies, different shapes, species, and sizes, families often incorporate Christmas trees into other parts of the home and as part of their outdoor holiday decor.
As of this year, the American Christmas Tree Association reported that 77 percent of U.S. households, nearly 96 million U.S. households, will display a Christmas tree in their home for the 2019 holiday season. Additionally, the number of U.S. households displaying more than one Christmas tree has increased by 10 percent over the last five years, with 16 percent of all American households displaying more than one Christmas tree.
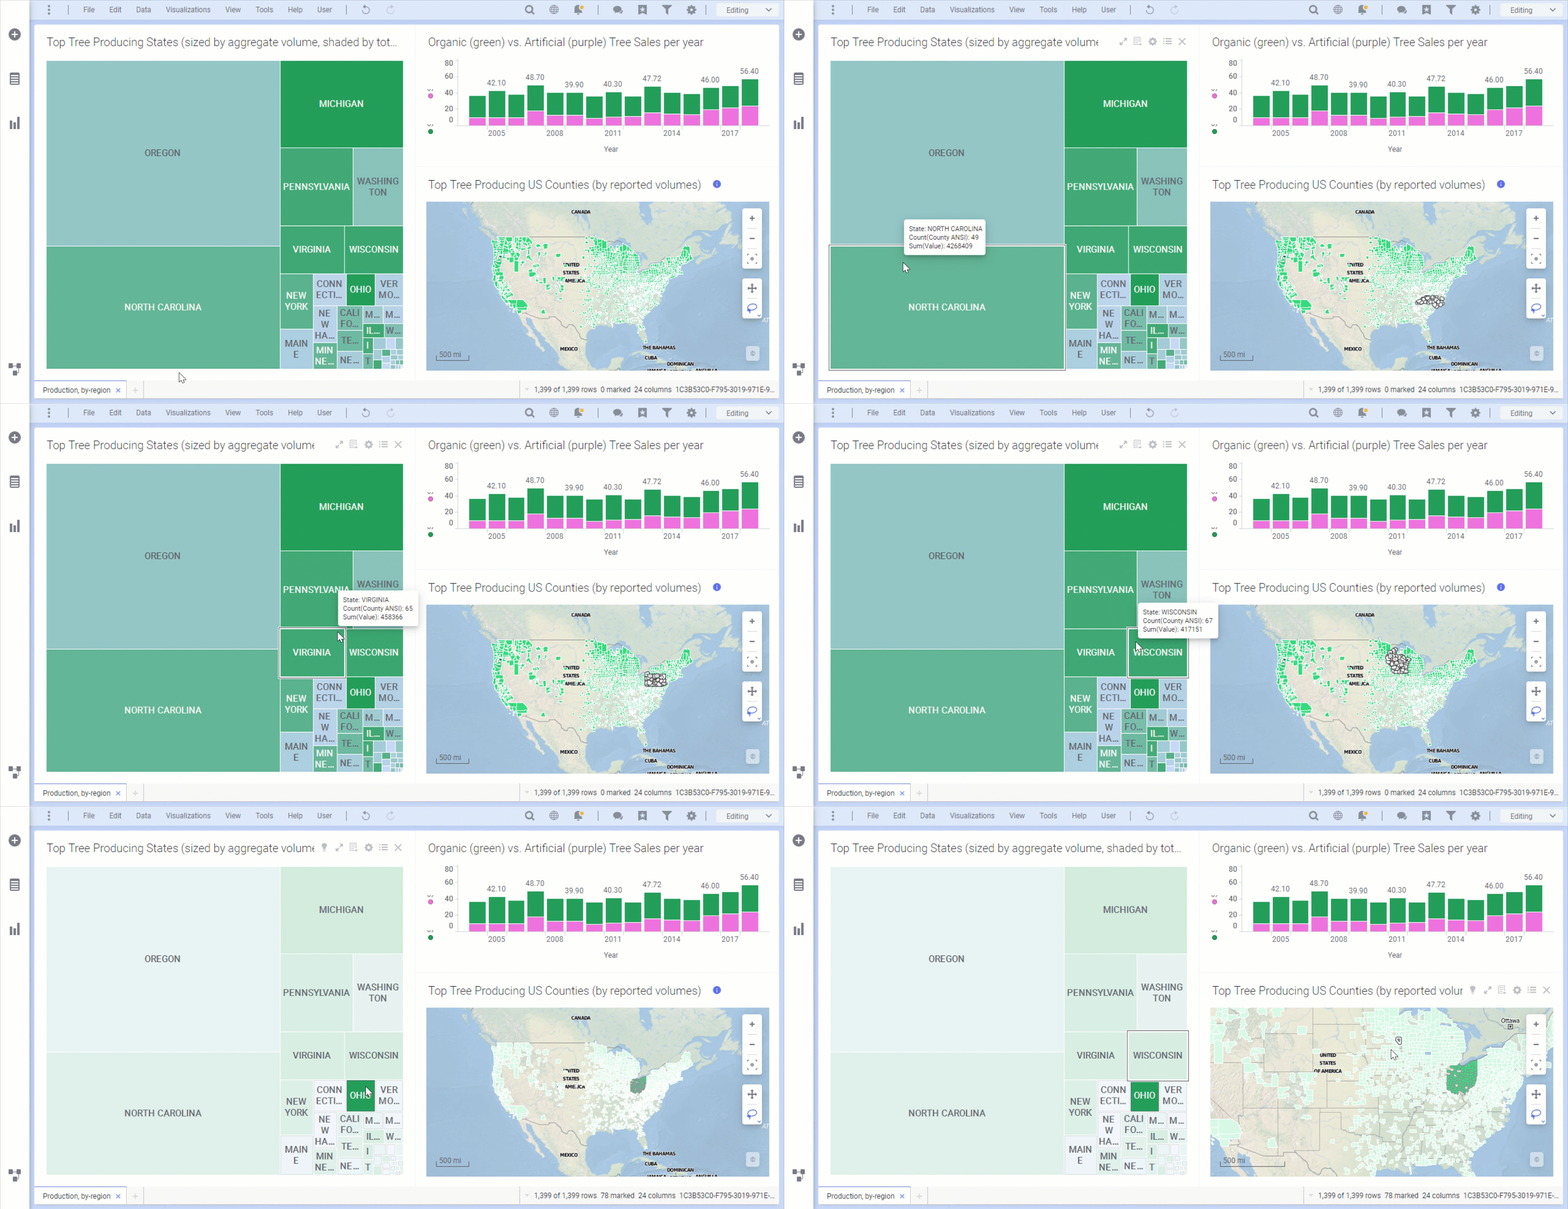
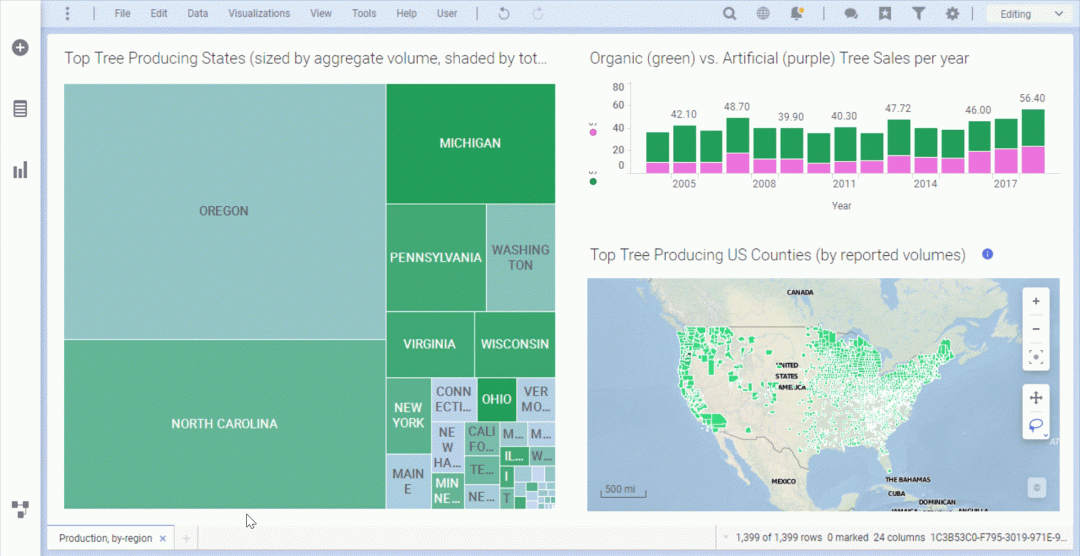
Several years back, a TIBCO data scientist created a visualization in Spotfire® that took a closer look at the Christmas tree industry, breaking down U.S. tree production by state and by revenue since 2004 as well as comparisons between the sales of real and artificial trees.
This year, we decided to revisit that analysis and update it with data through 2018 including an actual “TREEmap” visualization. Here are some findings from the data:

- Of the 50 states, Oregon has the largest Christmas tree production, and thus the highest revenue; North Carolina, Pennsylvania, Michigan, and Washington round out the top five
- In 2018, 32.8 million real Christmas trees were purchased, while 23.6 million new fake trees were purchased, a trend that has continued to increase post-recession
- Real tree purchases increased by 20 percent, while fake tree purchases increased by 12 percent compared to 2017; the sales of real trees have steadily increased over the years while sales of fake trees have remained stagnant
Interested in uncovering other cool Christmas tree insights you might share with your friends along with your holiday cheer, click here to do your own deep dive using this updated Spotfire visualization.
And beyond trees with friends, what other cool business insights might you discover and want to share with professional colleagues in 2020? You won’t know until you try. We’ll even give you a fresh 2020 start with your free 30-day trial of TIBCO Spotfire!
revisit that analysis and update it with data” open a new browser tab (while keeping blog open as well)
Leave a Comment
You must be logged in to post a comment.


